
House Prices in Trough Stone
House prices in Trough Stone have an overall average of £232,707 over the last year.
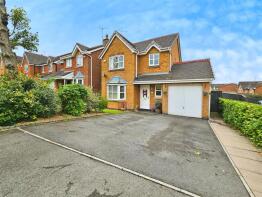
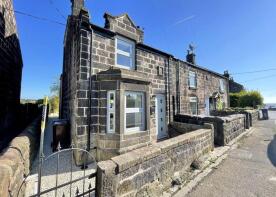
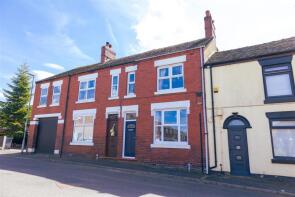
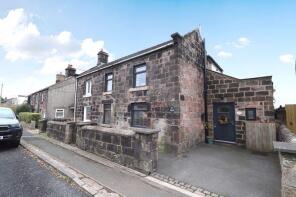
The majority of properties sold in Trough Stone during the last year were semi-detached properties, selling for an average price of £204,442. Detached properties sold for an average of £292,122, with terraced properties fetching £163,555.
Overall, the historical sold prices in Trough Stone over the last year were similar to the previous year and 3% up on the 2022 peak of £225,300.
Properties Sold
29, Conway Road, Stoke-on-trent ST8 7AL
| Today | See what it's worth now |
| 20 Mar 2026 | £275,000 |
| 5 Apr 2007 | £150,000 |
8, Zurich Avenue, Stoke-on-trent ST8 7FA
| Today | See what it's worth now |
| 13 Mar 2026 | £342,500 |
| 27 Nov 2015 | £272,495 |
No other historical records.
1, Kingston Place, Biddulph ST8 7EL
| Today | See what it's worth now |
| 6 Mar 2026 | £185,000 |
No other historical records.
64, Conway Road, Stoke-on-trent ST8 7AW
| Today | See what it's worth now |
| 6 Mar 2026 | £265,000 |
| 19 Apr 2022 | £245,000 |
No other historical records.
431, New Street, Stoke-on-trent ST8 7NG
| Today | See what it's worth now |
| 6 Mar 2026 | £300,000 |
| 7 May 2004 | £144,500 |
No other historical records.
24, Slater Street, Stoke-on-trent ST8 6JF
| Today | See what it's worth now |
| 26 Feb 2026 | £169,000 |
| 4 Feb 2025 | £100,000 |
6, Havelock Grove, Stoke-on-trent ST8 7PQ
| Today | See what it's worth now |
| 20 Feb 2026 | £177,000 |
| 22 Jul 2004 | £105,000 |
The Bungalow, Gunn Street, Stoke-on-trent ST8 6AY
| Today | See what it's worth now |
| 20 Feb 2026 | £213,000 |
| 11 Jan 2019 | £170,000 |
49, Tunstall Road, Stoke-on-trent ST8 6HJ
| Today | See what it's worth now |
| 19 Feb 2026 | £132,000 |
| 4 Sep 2020 | £115,000 |
7, Weaver Close, Biddulph ST8 7HJ
| Today | See what it's worth now |
| 16 Feb 2026 | £190,000 |
No other historical records.
9, Barmouth Grove, Brindley Ford, Stoke-on-trent ST8 7QE
| Today | See what it's worth now |
| 16 Feb 2026 | £151,500 |
| 9 Nov 2007 | £117,000 |
39, Well Street, Stoke-on-trent ST8 6HX
| Today | See what it's worth now |
| 16 Feb 2026 | £170,000 |
| 18 Aug 2022 | £162,000 |
No other historical records.
6, Bellringer Close, Stoke-on-trent ST8 7PH
| Today | See what it's worth now |
| 13 Feb 2026 | £210,000 |
| 8 Feb 2019 | £156,500 |
5, Dales Close, Stoke-on-trent ST8 7LZ
| Today | See what it's worth now |
| 6 Feb 2026 | £220,000 |
| 3 Mar 2017 | £162,500 |
No other historical records.
59, Swallow Walk, Stoke-on-trent ST8 6TY


| Today | See what it's worth now |
| 30 Jan 2026 | £150,000 |
| 14 Feb 1997 | £36,000 |
No other historical records.
49, Severn Close, Stoke-on-trent ST8 7PG
| Today | See what it's worth now |
| 30 Jan 2026 | £130,000 |
| 26 Jan 2018 | £99,000 |
8, Menai Drive, Knypersley, Biddulph ST8 7BN
| Today | See what it's worth now |
| 30 Jan 2026 | £340,000 |
No other historical records.
27, Pen-y-bont Walk, Stoke-on-trent ST8 7XJ
| Today | See what it's worth now |
| 30 Jan 2026 | £303,000 |
| 23 Feb 2001 | £90,220 |
No other historical records.
201, Moorland Road, Stoke-on-trent ST8 6TH

| Today | See what it's worth now |
| 23 Jan 2026 | £171,500 |
| 6 Apr 2023 | £148,500 |
294, New Street, Stoke-on-trent ST8 7NQ
| Today | See what it's worth now |
| 22 Jan 2026 | £269,500 |
| 17 Feb 2004 | £73,000 |
No other historical records.
5, Finch Street, Brindley Ford, Stoke-on-trent ST8 7QQ
| Today | See what it's worth now |
| 21 Jan 2026 | £156,500 |
| 30 Sep 2015 | £89,950 |
322, New Street, Stoke-on-trent ST8 7NQ
| Today | See what it's worth now |
| 20 Jan 2026 | £272,500 |
| 2 Feb 2024 | £250,000 |
14, Moorfield Avenue, Stoke-on-trent ST8 6HT

| Today | See what it's worth now |
| 13 Jan 2026 | £205,000 |
| 12 Oct 2007 | £133,000 |
No other historical records.
4, Zurich Avenue, Stoke-on-trent ST8 7FA
| Today | See what it's worth now |
| 7 Jan 2026 | £215,000 |
| 29 Sep 2023 | £200,000 |
2, Montreux Walk, Stoke-on-trent ST8 7FP

| Today | See what it's worth now |
| 19 Dec 2025 | £217,500 |
| 31 Mar 2016 | £189,995 |
No other historical records.
Source Acknowledgement: © Crown copyright. England and Wales house price data is publicly available information produced by the HM Land Registry.This material was last updated on 9 April 2026. It covers the period from 1 January 1995 to 27 February 2026 and contains property transactions which have been registered during that period. Contains HM Land Registry data © Crown copyright and database right 2026. This data is licensed under the Open Government Licence v3.0.
Disclaimer: Rightmove.co.uk provides this HM Land Registry data "as is". The burden for fitness of the data relies completely with the user and is provided for informational purposes only. No warranty, express or implied, is given relating to the accuracy of content of the HM Land Registry data and Rightmove does not accept any liability for error or omission. If you have found an error with the data or need further information please contact HM Land Registry.
Permitted Use: Viewers of this Information are granted permission to access this Crown copyright material and to download it onto electronic, magnetic, optical or similar storage media provided that such activities are for private research, study or in-house use only. Any other use of the material requires the formal written permission of Land Registry which can be requested from us, and is subject to an additional licence and associated charge.
Map data ©OpenStreetMap contributors.
Rightmove takes no liability for your use of, or reliance on, Rightmove's Instant Valuation due to the limitations of our tracking tool listed here. Use of this tool is taken entirely at your own risk. All rights reserved.