
House Prices in Tynewydd
House prices in Tynewydd have an overall average of £133,529 over the last year.
The majority of properties sold in Tynewydd during the last year were terraced properties, selling for an average price of £112,936. Semi-detached properties sold for an average of £156,992, with detached properties fetching £266,000.
Overall, the historical sold prices in Tynewydd over the last year were 19% up on the previous year and 21% up on the 2022 peak of £110,510.
Properties Sold
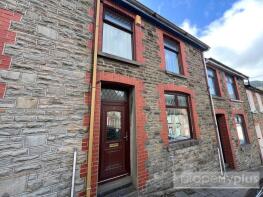
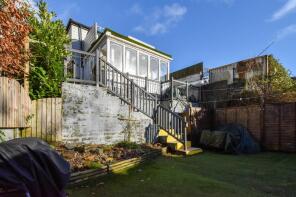
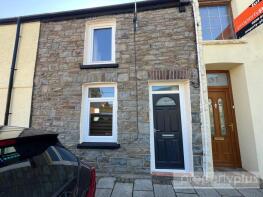
46, Miskin Street, Tynewydd, Treorchy CF42 5LR
| Today | See what it's worth now |
| 27 Mar 2026 | £136,000 |
| 5 Nov 2020 | £119,995 |
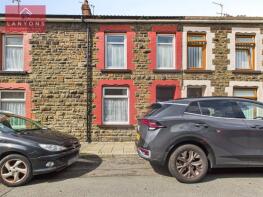
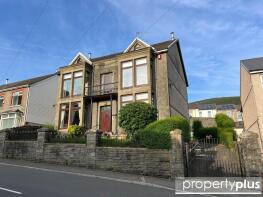
107, Brook Street, Treorchy CF42 5SF
| Today | See what it's worth now |
| 6 Mar 2026 | £95,000 |
| 25 Jun 2004 | £15,000 |
No other historical records.
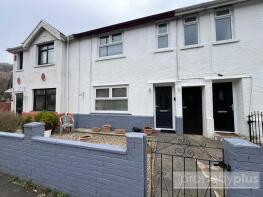
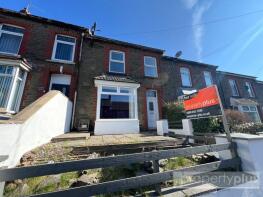
13, Cwrt Yr Ysgol, Treorchy CF42 5PX
| Today | See what it's worth now |
| 6 Mar 2026 | £300,000 |
| 21 Sep 2009 | £100,000 |
No other historical records.
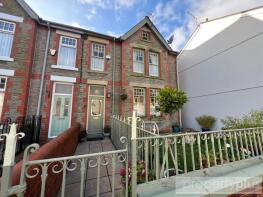
100, Dumfries Street, Treorchy CF42 5RE
| Today | See what it's worth now |
| 26 Feb 2026 | £78,000 |
| 18 Jan 2019 | £70,000 |
24, St Alban's Road, Tynewydd, Treherbert CF42 5DD
| Today | See what it's worth now |
| 6 Feb 2026 | £165,000 |
No other historical records.
11, Gwendoline Street, Treorchy CF42 5BW

| Today | See what it's worth now |
| 30 Jan 2026 | £90,000 |
| 23 Mar 2018 | £48,000 |
8, Mary Street, Treorchy CF42 5AE

| Today | See what it's worth now |
| 16 Jan 2026 | £125,000 |
| 20 Apr 2023 | £105,000 |
18, Brook Street, Blaenrhondda CF42 5SB

| Today | See what it's worth now |
| 15 Jan 2026 | £95,000 |
No other historical records.
42, Dumfries Street, Treherbert CF42 5PT
| Today | See what it's worth now |
| 19 Dec 2025 | £122,500 |
| 17 Nov 2023 | £93,295 |
No other historical records.
3, Eileen Place, Tynewydd, Treorchy CF42 5BU

| Today | See what it's worth now |
| 17 Dec 2025 | £107,000 |
| 9 Sep 2011 | £69,000 |
39, Blaenrhondda Road, Blaenrhondda CF42 5SP
| Today | See what it's worth now |
| 10 Dec 2025 | £118,500 |
No other historical records.
11, Crichton Street, Treorchy CF42 5RA
| Today | See what it's worth now |
| 9 Dec 2025 | £110,000 |
| 28 Mar 2014 | £72,000 |
No other historical records.
51, Eileen Place, Tynewydd, Treherbert CF42 5BU
| Today | See what it's worth now |
| 5 Dec 2025 | £90,000 |
No other historical records.
38, Blaenrhondda Road, Blaenrhondda CF42 5SP
| Today | See what it's worth now |
| 28 Nov 2025 | £105,000 |
No other historical records.
95 Vision, Gwendoline Street, Treorchy CF42 5BW
| Today | See what it's worth now |
| 27 Nov 2025 | £104,550 |
| 10 Dec 2019 | £65,000 |
No other historical records.
8, Eleanor Street, Treorchy CF42 5AD
| Today | See what it's worth now |
| 26 Nov 2025 | £130,000 |
| 4 Jul 2008 | £69,000 |
97, Dumfries Street, Treorchy CF42 5RE
| Today | See what it's worth now |
| 25 Nov 2025 | £75,000 |
| 25 Mar 2011 | £35,000 |
No other historical records.
48, Bute Street, Treorchy CF42 5NR

| Today | See what it's worth now |
| 14 Nov 2025 | £159,999 |
| 21 Dec 2020 | £127,500 |
No other historical records.
15, St Alban's Road, Tynewydd, Treherbert CF42 5DD
| Today | See what it's worth now |
| 12 Nov 2025 | £330,000 |
No other historical records.
9, St Alban's Road, Tynewydd, Treorchy CF42 5DD
| Today | See what it's worth now |
| 6 Nov 2025 | £135,000 |
| 16 Apr 2021 | £125,000 |
58 The Vicarage, Miskin Street, Tynewydd, Treorchy CF42 5LR
| Today | See what it's worth now |
| 28 Oct 2025 | £269,950 |
| 11 May 2007 | £140,000 |
31, Victoria Street, Treorchy CF42 5LL

| Today | See what it's worth now |
| 17 Oct 2025 | £125,000 |
| 27 Jan 2023 | £120,000 |
30, Victoria Street, Treorchy CF42 5LL
| Today | See what it's worth now |
| 10 Oct 2025 | £83,000 |
| 23 Nov 2018 | £50,000 |
Source Acknowledgement: © Crown copyright. England and Wales house price data is publicly available information produced by the HM Land Registry.This material was last updated on 9 July 2026. It covers the period from 1 January 1995 to 30 April 2026 and contains property transactions which have been registered during that period. Contains HM Land Registry data © Crown copyright and database right 2026. This data is licensed under the Open Government Licence v3.0.
Disclaimer: Rightmove.co.uk provides this HM Land Registry data "as is". The burden for fitness of the data relies completely with the user and is provided for informational purposes only. No warranty, express or implied, is given relating to the accuracy of content of the HM Land Registry data and Rightmove does not accept any liability for error or omission. If you have found an error with the data or need further information please contact HM Land Registry.
Permitted Use: Viewers of this Information are granted permission to access this Crown copyright material and to download it onto electronic, magnetic, optical or similar storage media provided that such activities are for private research, study or in-house use only. Any other use of the material requires the formal written permission of Land Registry which can be requested from us, and is subject to an additional licence and associated charge.
Rightmove takes no liability for your use of, or reliance on, Rightmove's Instant Valuation due to the limitations of our tracking tool listed here. Use of this tool is taken entirely at your own risk. All rights reserved.