
House Prices in Tyn Y Bryn
House prices in Tyn Y Bryn have an overall average of £179,917 over the last year.
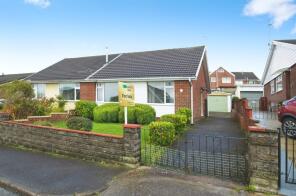
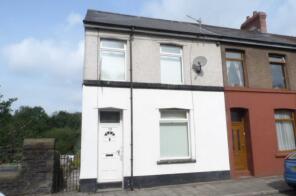
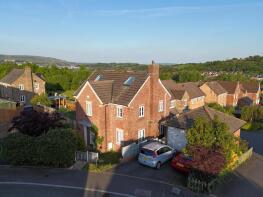
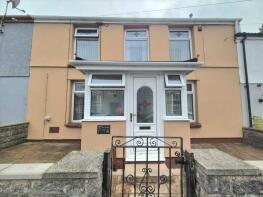
The majority of properties sold in Tyn Y Bryn during the last year were terraced properties, selling for an average price of £142,133. Semi-detached properties sold for an average of £171,737, with detached properties fetching £293,633.
Overall, the historical sold prices in Tyn Y Bryn over the last year were similar to the previous year and 2% up on the 2023 peak of £176,512.
Properties Sold
1, Manley Close, Porth CF39 8NS

| Today | See what it's worth now |
| 2 Apr 2026 | £217,500 |
| 30 Aug 2013 | £95,000 |
No other historical records.
11, Parklands Road, Porth CF39 8PE
| Today | See what it's worth now |
| 2 Apr 2026 | £160,000 |
| 18 Aug 2015 | £125,000 |
No other historical records.
126, Mill Street, Porth CF39 8AF
| Today | See what it's worth now |
| 31 Mar 2026 | £150,000 |
| 26 Oct 2015 | £87,000 |
No other historical records.
115, Mill Street, Porth CF39 8AE

| Today | See what it's worth now |
| 27 Mar 2026 | £186,950 |
| 28 Apr 2000 | £31,000 |
No other historical records.
18, Maes-y-bryn, Porth CF39 8LA
| Today | See what it's worth now |
| 18 Mar 2026 | £200,000 |
| 3 Nov 2023 | £140,000 |
No other historical records.
88, Prichard Street, Tonyrefail CF39 8PA
| Today | See what it's worth now |
| 12 Mar 2026 | £138,000 |
No other historical records.
39, Beech Wood Drive, Porth CF39 8JL
| Today | See what it's worth now |
| 10 Mar 2026 | £362,000 |
| 2 May 2014 | £181,800 |
127, High Street, Gilfach Goch, Gilfach-goch CF39 8SW
| Today | See what it's worth now |
| 6 Mar 2026 | £150,720 |
No other historical records.
24, Nant Eirin, Porth CF39 8DP
| Today | See what it's worth now |
| 6 Mar 2026 | £165,000 |
| 27 Sep 2024 | £160,000 |
8, Cedar Wood Drive, Porth CF39 8JB
| Today | See what it's worth now |
| 26 Feb 2026 | £220,000 |
| 27 Oct 2000 | £74,950 |
No other historical records.
8, Beech Wood Drive, Porth CF39 8JE
| Today | See what it's worth now |
| 25 Feb 2026 | £220,000 |
| 21 Dec 2016 | £124,950 |
2, Wyndham Street, Evanstown, Porth CF39 8RT
| Today | See what it's worth now |
| 20 Feb 2026 | £120,000 |
| 16 Mar 2023 | £117,000 |
62, Worcester Court, Porth CF39 8JT
| Today | See what it's worth now |
| 13 Feb 2026 | £260,000 |
| 3 Nov 2017 | £166,995 |
No other historical records.
54, Worcester Court, Porth CF39 8JT
| Today | See what it's worth now |
| 13 Feb 2026 | £335,000 |
| 25 Oct 2017 | £214,995 |
No other historical records.
7, Garth Street, Coed-ely, Porth CF39 8BG
| Today | See what it's worth now |
| 10 Feb 2026 | £147,000 |
| 25 Oct 2000 | £16,500 |
No other historical records.
62, Tylchawen Terrace, Porth CF39 8AH
| Today | See what it's worth now |
| 6 Feb 2026 | £200,000 |
| 20 Dec 2018 | £160,000 |
No other historical records.
55, Martin Crescent, Porth CF39 8NT
| Today | See what it's worth now |
| 5 Feb 2026 | £179,950 |
| 8 Jul 2005 | £35,000 |
No other historical records.
8, Heol Pymmer, Porth CF39 8DN

| Today | See what it's worth now |
| 2 Feb 2026 | £110,000 |
| 1 May 2007 | £93,500 |
No other historical records.
34, Llantrisant Road, Porth CF39 8PP
| Today | See what it's worth now |
| 30 Jan 2026 | £131,495 |
| 30 Jan 2006 | £74,000 |
No other historical records.
21, Pretoria Road, Porth CF39 8PW
| Today | See what it's worth now |
| 16 Jan 2026 | £140,000 |
| 31 Oct 1997 | £30,000 |
No other historical records.
22, Wyndham Street, Evanstown, Porth CF39 8RT
| Today | See what it's worth now |
| 13 Jan 2026 | £135,000 |
No other historical records.
15, Winslade Avenue, Porth CF39 8NP
| Today | See what it's worth now |
| 13 Jan 2026 | £156,000 |
| 26 Sep 2006 | £94,000 |
No other historical records.
127, Mill Street, Porth CF39 8AE
| Today | See what it's worth now |
| 9 Jan 2026 | £115,000 |
| 25 May 2005 | £75,000 |
No other historical records.

Source Acknowledgement: © Crown copyright. England and Wales house price data is publicly available information produced by the HM Land Registry.This material was last updated on 9 July 2026. It covers the period from 1 January 1995 to 30 April 2026 and contains property transactions which have been registered during that period. Contains HM Land Registry data © Crown copyright and database right 2026. This data is licensed under the Open Government Licence v3.0.
Disclaimer: Rightmove.co.uk provides this HM Land Registry data "as is". The burden for fitness of the data relies completely with the user and is provided for informational purposes only. No warranty, express or implied, is given relating to the accuracy of content of the HM Land Registry data and Rightmove does not accept any liability for error or omission. If you have found an error with the data or need further information please contact HM Land Registry.
Permitted Use: Viewers of this Information are granted permission to access this Crown copyright material and to download it onto electronic, magnetic, optical or similar storage media provided that such activities are for private research, study or in-house use only. Any other use of the material requires the formal written permission of Land Registry which can be requested from us, and is subject to an additional licence and associated charge.
Rightmove takes no liability for your use of, or reliance on, Rightmove's Instant Valuation due to the limitations of our tracking tool listed here. Use of this tool is taken entirely at your own risk. All rights reserved.