
House Prices in Tynedale
House prices in Tynedale have an overall average of £386,500 over the last year.
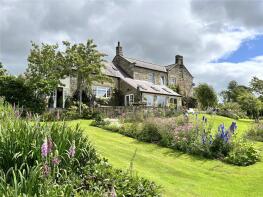
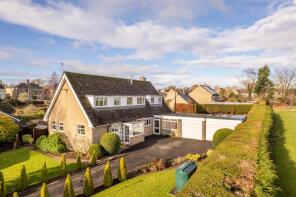
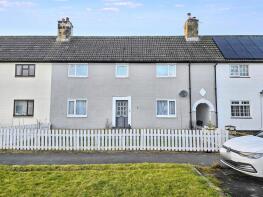
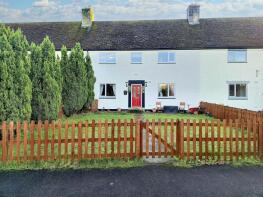
The majority of properties sold in Tynedale during the last year were detached properties, selling for an average price of £729,500. Semi-detached properties sold for an average of £162,500, with terraced properties fetching £176,000.
Overall, the historical sold prices in Tynedale over the last year were 26% up on the previous year and 47% up on the 2023 peak of £263,107.
Properties Sold
Chipchase House, Wark NE48 3NP
| Today | See what it's worth now |
| 3 Feb 2026 | £920,000 |
No other historical records.
Upper Flat, Carnaby House, The Green, Hexham NE48 3LG
| Today | See what it's worth now |
| 5 Dec 2025 | £135,000 |
No other historical records.
Creywell, Access Road To Wark First School, Hexham NE48 3LQ
| Today | See what it's worth now |
| 21 Nov 2025 | £539,000 |
| 19 Aug 2016 | £315,000 |
No other historical records.
16, Kern Green, Hexham NE48 3DZ
| Today | See what it's worth now |
| 26 Sep 2025 | £176,000 |
| 3 Feb 2023 | £170,000 |
8, St Michaels Mount, Wark NE48 3NA
| Today | See what it's worth now |
| 29 Aug 2025 | £162,500 |
No other historical records.
6, Middleburn End, Hexham NE48 3DY
| Today | See what it's worth now |
| 13 Jun 2025 | £172,000 |
| 4 Dec 2014 | £135,000 |
Allendale House, Front Street, Hexham NE48 3LG

| Today | See what it's worth now |
| 27 May 2025 | £200,000 |
| 23 Jul 2003 | £99,500 |
No other historical records.
2, Middle Cowden Cottages, C214 Nightfold Ridge Old Mine To Cowden, Hexham NE48 3JB

| Today | See what it's worth now |
| 30 Apr 2025 | £90,000 |
| 26 Mar 1999 | £65,000 |
15, River Meadow, Wark NE48 3BY
| Today | See what it's worth now |
| 26 Mar 2025 | £460,750 |
No other historical records.
Kimolos, Access Road To Wark First School, Hexham NE48 3LQ
| Today | See what it's worth now |
| 14 Mar 2025 | £490,000 |
| 30 Sep 2021 | £410,000 |
23, River Meadow, Wark NE48 3BY
| Today | See what it's worth now |
| 15 Oct 2024 | £455,950 |
No other historical records.
19, River Meadow, Wark NE48 3BY
| Today | See what it's worth now |
| 10 Oct 2024 | £489,950 |
No other historical records.
Rose Cottage, Elliott Terrace, Hexham NE48 3LE
| Today | See what it's worth now |
| 4 Oct 2024 | £119,500 |
| 24 Jan 2023 | £120,000 |
1 Church Lane House, Church Lane, Hexham NE48 3LX
| Today | See what it's worth now |
| 3 Oct 2024 | £385,000 |
| 27 Apr 2018 | £195,000 |
No other historical records.
5, Elliott Terrace, Wark NE48 3LE

| Today | See what it's worth now |
| 8 Aug 2024 | £185,500 |
| 4 Nov 2020 | £210,000 |
13, River Meadow, Wark NE48 3BY
| Today | See what it's worth now |
| 28 Jun 2024 | £446,737 |
No other historical records.
6, Church Lane, Hexham NE48 3LX
| Today | See what it's worth now |
| 18 Jun 2024 | £195,000 |
| 13 Feb 2019 | £155,000 |
Sunniside House, Front Street, Wark NE48 3LG
| Today | See what it's worth now |
| 24 May 2024 | £280,000 |
No other historical records.
4, River Meadow, Wark NE48 3BY
| Today | See what it's worth now |
| 17 May 2024 | £385,950 |
No other historical records.
3, St Michaels Mount, Hexham NE48 3NA
| Today | See what it's worth now |
| 9 May 2024 | £210,000 |
| 5 Jan 2018 | £165,000 |
No other historical records.
Fair View, Church Lane, Hexham NE48 3LX

| Today | See what it's worth now |
| 9 May 2024 | £258,500 |
| 27 Apr 2007 | £192,000 |
12, The Chalets, Hexham NE48 3EN
| Today | See what it's worth now |
| 12 Apr 2024 | £67,000 |
No other historical records.
25, River Meadow, Wark NE48 3BY
| Today | See what it's worth now |
| 27 Mar 2024 | £535,950 |
No other historical records.

Source Acknowledgement: © Crown copyright. England and Wales house price data is publicly available information produced by the HM Land Registry.This material was last updated on 9 July 2026. It covers the period from 1 January 1995 to 30 April 2026 and contains property transactions which have been registered during that period. Contains HM Land Registry data © Crown copyright and database right 2026. This data is licensed under the Open Government Licence v3.0.
Disclaimer: Rightmove.co.uk provides this HM Land Registry data "as is". The burden for fitness of the data relies completely with the user and is provided for informational purposes only. No warranty, express or implied, is given relating to the accuracy of content of the HM Land Registry data and Rightmove does not accept any liability for error or omission. If you have found an error with the data or need further information please contact HM Land Registry.
Permitted Use: Viewers of this Information are granted permission to access this Crown copyright material and to download it onto electronic, magnetic, optical or similar storage media provided that such activities are for private research, study or in-house use only. Any other use of the material requires the formal written permission of Land Registry which can be requested from us, and is subject to an additional licence and associated charge.
Rightmove takes no liability for your use of, or reliance on, Rightmove's Instant Valuation due to the limitations of our tracking tool listed here. Use of this tool is taken entirely at your own risk. All rights reserved.