
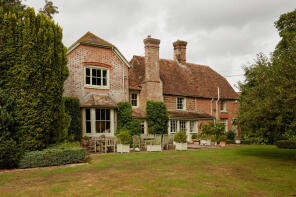
House Prices in Ulcombe
House prices in Ulcombe have an overall average of £430,900 over the last year.
The majority of properties sold in Ulcombe during the last year were semi-detached properties, selling for an average price of £342,375. Detached properties sold for an average of £785,000.
Overall, the historical sold prices in Ulcombe over the last year were 13% down on the previous year and 42% down on the 2017 peak of £744,000.
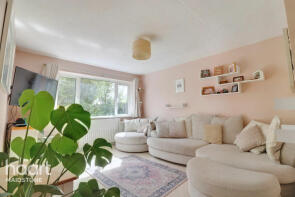
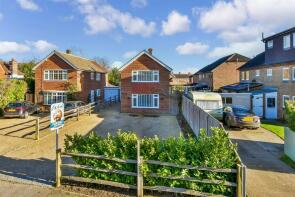
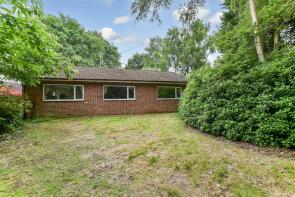
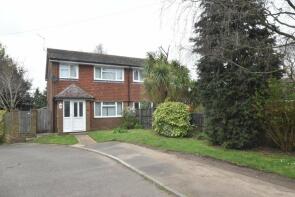
Properties Sold
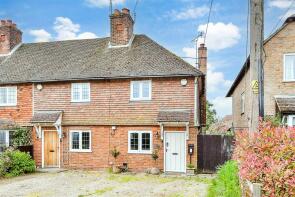
7, The Street, Maidstone ME17 1DT
| Today | See what it's worth now |
| 31 Mar 2026 | £357,000 |
| 4 Jun 2021 | £335,000 |
20, Chestnut Close, Maidstone ME17 1EA
| Today | See what it's worth now |
| 1 Dec 2025 | £287,500 |
| 24 Jun 2005 | £165,000 |
No other historical records.
1, Water Lane Cottages, Water Lane, Ulcombe, Harrietsham ME17 1DL

| Today | See what it's worth now |
| 28 Nov 2025 | £415,000 |
No other historical records.
Rose Croft, The Street, Maidstone ME17 1DP
| Today | See what it's worth now |
| 21 Oct 2025 | £785,000 |
| 23 Feb 2018 | £650,000 |
13, Chestnut Close, Ulcombe ME17 1EA
| Today | See what it's worth now |
| 23 Jul 2025 | £310,000 |
No other historical records.
8, The Street, Ulcombe ME17 1DT
| Today | See what it's worth now |
| 7 Feb 2025 | £325,000 |
| 28 Feb 2020 | £268,000 |
Longfellow House, Chapmans Place, Maidstone ME17 1GB

| Today | See what it's worth now |
| 28 Jan 2025 | £800,000 |
| 2 Nov 2005 | £477,000 |
No other historical records.
18, Lodge Gardens, Maidstone ME17 1DZ
| Today | See what it's worth now |
| 6 Dec 2024 | £325,000 |
| 7 Jul 2017 | £282,500 |
Owls Nest, Kingsnoad Farm, Pye Corner, Ulcombe ME17 1EG

| Today | See what it's worth now |
| 29 Nov 2024 | £600,000 |
| 5 Oct 2017 | £343,000 |
Four Oaks, Headcorn Road, Maidstone ME17 1HD

| Today | See what it's worth now |
| 31 Oct 2024 | £890,000 |
| 27 Feb 2004 | £499,950 |
No other historical records.
Petandy Sar, The Street, Maidstone ME17 1DX
| Today | See what it's worth now |
| 30 Oct 2024 | £436,000 |
| 21 Feb 2020 | £352,000 |
Little Ferndale, Lenham Road, Kingswood ME17 1LX
| Today | See what it's worth now |
| 4 Oct 2024 | £400,000 |
No other historical records.
17, Lodge Gardens, Maidstone ME17 1DZ
| Today | See what it's worth now |
| 30 Aug 2024 | £343,000 |
| 9 Aug 2018 | £290,000 |
Pastorale, Ulcombe Hill, Ulcombe ME17 1DN

| Today | See what it's worth now |
| 5 Aug 2024 | £700,000 |
No other historical records.
9, Headcorn Road, Ulcombe ME17 1EB

| Today | See what it's worth now |
| 31 Jul 2024 | £280,000 |
No other historical records.
Millbrook, The Street, Maidstone ME17 1DR

| Today | See what it's worth now |
| 18 Jul 2024 | £370,000 |
No other historical records.
Cowslip Cottage, Windmill Hill, Maidstone ME17 1LP

| Today | See what it's worth now |
| 30 May 2024 | £885,000 |
| 23 Sep 2021 | £825,000 |
Chantlers, The Street, Maidstone ME17 1DX

| Today | See what it's worth now |
| 2 May 2024 | £462,500 |
| 5 Apr 2005 | £300,000 |
Constance Villa, Pye Corner, Maidstone ME17 1EF

| Today | See what it's worth now |
| 28 Mar 2024 | £425,000 |
No other historical records.
10, Chestnut Close, Maidstone ME17 1EA

| Today | See what it's worth now |
| 16 Feb 2024 | £210,000 |
No other historical records.
Orchard House, The Street, Ulcombe ME17 1DR

| Today | See what it's worth now |
| 19 Jan 2024 | £696,000 |
No other historical records.
Hillcroft, Ulcombe Hill, Maidstone ME17 1DJ

| Today | See what it's worth now |
| 25 Aug 2023 | £999,950 |
No other historical records.
Street House, The Street, Maidstone ME17 1DP
| Today | See what it's worth now |
| 3 Aug 2023 | £932,500 |
| 30 Jun 2017 | £664,500 |


Source Acknowledgement: © Crown copyright. England and Wales house price data is publicly available information produced by the HM Land Registry.This material was last updated on 9 July 2026. It covers the period from 1 January 1995 to 30 April 2026 and contains property transactions which have been registered during that period. Contains HM Land Registry data © Crown copyright and database right 2026. This data is licensed under the Open Government Licence v3.0.
Disclaimer: Rightmove.co.uk provides this HM Land Registry data "as is". The burden for fitness of the data relies completely with the user and is provided for informational purposes only. No warranty, express or implied, is given relating to the accuracy of content of the HM Land Registry data and Rightmove does not accept any liability for error or omission. If you have found an error with the data or need further information please contact HM Land Registry.
Permitted Use: Viewers of this Information are granted permission to access this Crown copyright material and to download it onto electronic, magnetic, optical or similar storage media provided that such activities are for private research, study or in-house use only. Any other use of the material requires the formal written permission of Land Registry which can be requested from us, and is subject to an additional licence and associated charge.
Rightmove takes no liability for your use of, or reliance on, Rightmove's Instant Valuation due to the limitations of our tracking tool listed here. Use of this tool is taken entirely at your own risk. All rights reserved.