
House Prices in Ulverston
House prices in Ulverston have an overall average of £283,134 over the last year.
The majority of properties sold in Ulverston during the last year were terraced properties, selling for an average price of £220,132. Semi-detached properties sold for an average of £257,187, with detached properties fetching £460,263.
Overall, the historical sold prices in Ulverston over the last year were similar to the previous year and 3% down on the 2023 peak of £291,875.
Properties Sold
20, Church Fields Avenue, Ulverston LA12 7HE
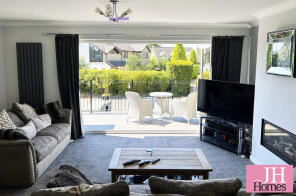
| Today | See today's value |
| 7 Aug 2026 | £430,000 |
| 4 May 2018 | £277,500 |
Ellerswell, Neville Street, Ulverston LA12 0BJ
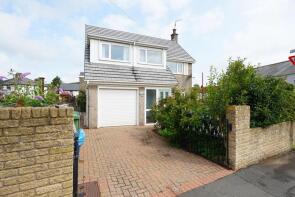
| Today | See today's value |
| 3 Aug 2026 | £262,500 |
| 13 Oct 2003 | £125,000 |
No other historical records.
2, Sea View, Ulverston LA12 7EX
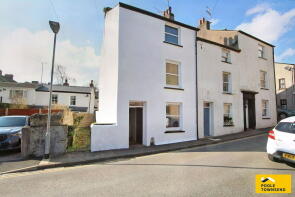
| Today | See today's value |
| 27 Jul 2026 | £292,500 |
| 13 Jun 2006 | £214,000 |
5, Central Drive, Ulverston LA12 9LD

| Today | See today's value |
| 27 Jul 2026 | £305,000 |
| 29 Sep 1995 | £67,000 |
No other historical records.
19, Rowan Avenue, Ulverston LA12 9JA
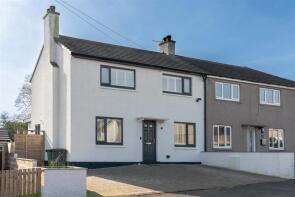
| Today | See today's value |
| 24 Jul 2026 | £340,000 |
| 30 Oct 2020 | £163,450 |
No other historical records.
5, Next Ness Cottages, Next Ness, Ulverston LA12 7QW

| Today | See today's value |
| 24 Jul 2026 | £250,000 |
| 14 Feb 2019 | £164,000 |
42, Casson Street, Ulverston LA12 7JQ
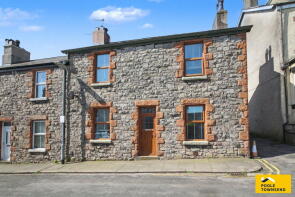
| Today | See today's value |
| 22 Jul 2026 | £275,000 |
| 22 Jun 2021 | £225,000 |
32, Clarence Street, Ulverston LA12 7JJ

| Today | See today's value |
| 21 Jul 2026 | £325,000 |
| 13 Feb 2012 | £197,500 |
No other historical records.
9, Beckside Road, Ulverston LA12 7DE
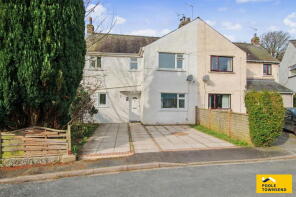
| Today | See today's value |
| 17 Jul 2026 | £240,000 |
| 21 Oct 2015 | £150,500 |
40, Sail Street, Ulverston LA12 9FJ

| Today | See today's value |
| 17 Jul 2026 | £450,000 |
| 22 Oct 2021 | £351,495 |
No other historical records.
107, Steel Street, Ulverston LA12 9DY
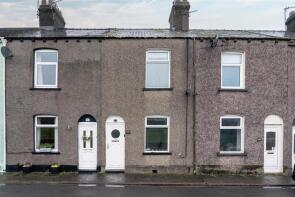
| Today | See today's value |
| 16 Jul 2026 | £170,000 |
| 30 Sep 2022 | £136,000 |
39, Rydal Road, Ulverston LA12 9BU
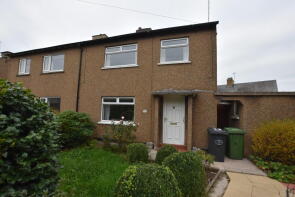
| Today | See today's value |
| 16 Jul 2026 | £160,000 |
No other historical records.
7, The Drive, Ulverston LA12 0DT

| Today | See today's value |
| 15 Jul 2026 | £553,000 |
| 20 Mar 2023 | £530,000 |
13, Clarence Street, Ulverston LA12 7JJ
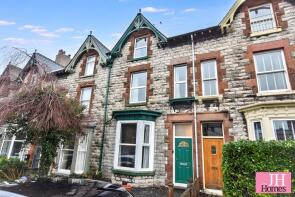
| Today | See today's value |
| 10 Jul 2026 | £325,000 |
| 30 Nov 2016 | £180,000 |
No other historical records.
14, Leven Road, Ulverston LA12 9FH

| Today | See today's value |
| 9 Jul 2026 | £500,000 |
| 16 Jun 2023 | £445,995 |
No other historical records.
4, Lightburn Road, Ulverston LA12 0AU
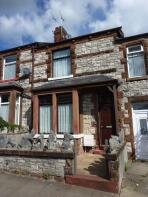
| Today | See today's value |
| 8 Jul 2026 | £210,000 |
| 13 Oct 2014 | £142,500 |
No other historical records.
8, Beechlands, Ulverston LA12 9SQ
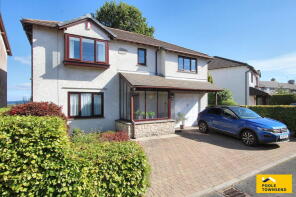
| Today | See today's value |
| 3 Jul 2026 | £515,000 |
No other historical records.
19, Hill Fall, Ulverston LA12 0BQ

| Today | See today's value |
| 3 Jul 2026 | £152,000 |
| 14 Oct 2016 | £181,000 |
4, Cross Lane Court, Cross Lane, Ulverston LA12 9DQ

| Today | See today's value |
| 1 Jul 2026 | £98,560 |
| 28 Jan 2019 | £86,240 |
23, Woodland Road, Ulverston LA12 0DX

| Today | See today's value |
| 1 Jul 2026 | £720,000 |
| 7 Aug 2017 | £550,000 |
No other historical records.
48, Casson Street, Ulverston LA12 7JQ

| Today | See today's value |
| 26 Jun 2026 | £272,500 |
| 20 Dec 2023 | £250,000 |
5, Willow Tree Close, Ulverston LA12 7GY
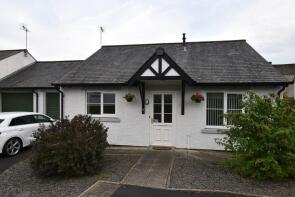
| Today | See today's value |
| 23 Jun 2026 | £198,750 |
No other historical records.
7, Colt House Lane, Ulverston LA12 0SF
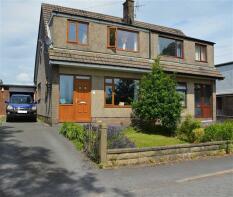
| Today | See today's value |
| 19 Jun 2026 | £133,705 |
| 24 Oct 2014 | £179,000 |
Rightmove takes no liability for your use of, or reliance on, Rightmove's Instant Valuation due to the limitations of our tracking tool listed here. Use of this tool is taken entirely at your own risk. All rights reserved.