
House Prices in Uplees
House prices in Uplees have an overall average of £464,375 over the last year.
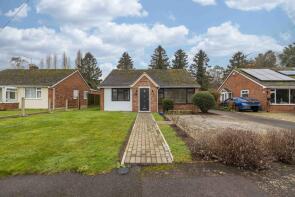
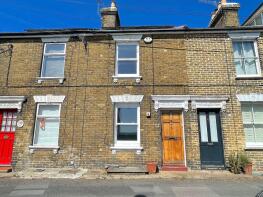
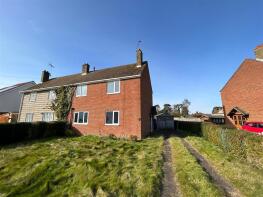
The majority of properties sold in Uplees during the last year were detached properties, selling for an average price of £555,000. Semi-detached properties sold for an average of £433,583, with terraced properties fetching £257,125.
Overall, the historical sold prices in Uplees over the last year were 23% down on the previous year and 33% down on the 2023 peak of £695,750.
Properties Sold
Stocks Cottage, Ashford Road, Faversham ME13 0NH
| Today | See what it's worth now |
| 16 Apr 2026 | £450,000 |
| 14 Dec 2006 | £275,000 |
No other historical records.
Oast View, Eastling Road, Faversham ME13 0DU

| Today | See what it's worth now |
| 31 Mar 2026 | £405,000 |
| 1 Oct 2008 | £207,000 |
No other historical records.
Brownings Oast, Hansletts Lane, Faversham ME13 0RS

| Today | See what it's worth now |
| 11 Mar 2026 | £715,000 |
| 5 Aug 2015 | £492,500 |
13, Church Road, Faversham ME13 0QA
| Today | See what it's worth now |
| 6 Mar 2026 | £258,500 |
| 20 Nov 2000 | £114,000 |
No other historical records.
2, Clock Tower, Lees Court Road, Sheldwich Lees, Sheldwich ME13 0ND

| Today | See what it's worth now |
| 24 Feb 2026 | £300,000 |
No other historical records.
7, Buckland Cottages, London Road, Faversham ME13 0SY

| Today | See what it's worth now |
| 6 Feb 2026 | £300,000 |
| 1 Apr 2022 | £240,000 |
No other historical records.
12, Russell Place, Faversham ME13 0QF
| Today | See what it's worth now |
| 23 Jan 2026 | £270,000 |
| 30 Jun 1998 | £41,000 |
No other historical records.
Copperfield, Bagshill Road, Leaveland, Sheldwich ME13 0PB
| Today | See what it's worth now |
| 15 Dec 2025 | £437,000 |
No other historical records.
Record Cottage, Nursery Lane, Sheldwich Lees, Sheldwich ME13 0DZ

| Today | See what it's worth now |
| 28 Oct 2025 | £470,000 |
No other historical records.
Maybank, Ashford Road, North Street, Faversham ME13 0LN
| Today | See what it's worth now |
| 24 Oct 2025 | £365,000 |
| 8 Jan 2003 | £160,000 |
No other historical records.
1, Mummery Court, Faversham ME13 0ES
| Today | See what it's worth now |
| 22 Oct 2025 | £487,000 |
| 29 Nov 2002 | £255,000 |
No other historical records.
Glebe House, Badlesmere Lees, Badlesmere ME13 0NX
| Today | See what it's worth now |
| 17 Oct 2025 | £730,000 |
No other historical records.
Pineta, The Street, Eastling ME13 0AX
| Today | See what it's worth now |
| 15 Oct 2025 | £640,000 |
No other historical records.
7, Mummery Court, Faversham ME13 0ES
| Today | See what it's worth now |
| 3 Oct 2025 | £373,000 |
| 12 Dec 2002 | £225,000 |
No other historical records.
Holly Tree Cottage, Green Road, Faversham ME13 0HY
| Today | See what it's worth now |
| 30 Sep 2025 | £825,000 |
| 24 Aug 2012 | £300,000 |
No other historical records.
5, Church Road, Faversham ME13 0QA
| Today | See what it's worth now |
| 17 Sep 2025 | £340,000 |
| 10 Jan 2003 | £159,000 |
No other historical records.
22, Bayfield, Faversham ME13 0EF

| Today | See what it's worth now |
| 20 Aug 2025 | £357,500 |
| 24 Jun 2021 | £315,000 |
Beacon Hill House, London Road, Faversham ME13 0SX
| Today | See what it's worth now |
| 1 Aug 2025 | £555,000 |
| 23 Nov 2018 | £400,000 |
No other historical records.
12, Meesons Close, Faversham ME13 0AW
| Today | See what it's worth now |
| 31 Jul 2025 | £525,000 |
| 6 Sep 2019 | £310,000 |
7, Church Road, Faversham ME13 0QA

| Today | See what it's worth now |
| 18 Jul 2025 | £725,000 |
| 12 Jan 2006 | £350,000 |
No other historical records.
Orchard House, Painters Forstal Road, Painters Forstal, Ospringe ME13 0DU
| Today | See what it's worth now |
| 14 Jul 2025 | £535,000 |
No other historical records.
25, Church Road, Oare ME13 0QA
| Today | See what it's worth now |
| 7 Jul 2025 | £200,000 |
No other historical records.
9, Bayfield, Painters Forstal ME13 0EF
| Today | See what it's worth now |
| 4 Jul 2025 | £297,000 |
No other historical records.


Source Acknowledgement: © Crown copyright. England and Wales house price data is publicly available information produced by the HM Land Registry.This material was last updated on 9 July 2026. It covers the period from 1 January 1995 to 30 April 2026 and contains property transactions which have been registered during that period. Contains HM Land Registry data © Crown copyright and database right 2026. This data is licensed under the Open Government Licence v3.0.
Disclaimer: Rightmove.co.uk provides this HM Land Registry data "as is". The burden for fitness of the data relies completely with the user and is provided for informational purposes only. No warranty, express or implied, is given relating to the accuracy of content of the HM Land Registry data and Rightmove does not accept any liability for error or omission. If you have found an error with the data or need further information please contact HM Land Registry.
Permitted Use: Viewers of this Information are granted permission to access this Crown copyright material and to download it onto electronic, magnetic, optical or similar storage media provided that such activities are for private research, study or in-house use only. Any other use of the material requires the formal written permission of Land Registry which can be requested from us, and is subject to an additional licence and associated charge.
Rightmove takes no liability for your use of, or reliance on, Rightmove's Instant Valuation due to the limitations of our tracking tool listed here. Use of this tool is taken entirely at your own risk. All rights reserved.