
House Prices in Upper Bucklebury
House prices in Upper Bucklebury have an overall average of £920,833 over the last year.
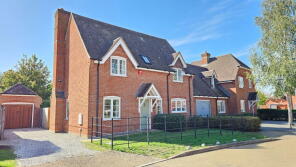
The majority of properties sold in Upper Bucklebury during the last year were detached properties, selling for an average price of £980,000. Semi-detached properties sold for an average of £625,000.
Overall, the historical sold prices in Upper Bucklebury over the last year were 45% up on the previous year and 35% up on the 2023 peak of £679,643.
Properties Sold
38, Mortons Lane, Upper Bucklebury, Reading RG7 6QQ
| Today | See what it's worth now |
| 31 Mar 2026 | £625,000 |
| 1 Nov 2006 | £325,000 |
No other historical records.
31, Broad Lane, Upper Bucklebury, Reading RG7 6QH
| Today | See what it's worth now |
| 6 Feb 2026 | £790,000 |
| 19 Jul 2006 | £249,950 |
No other historical records.
Taradale, Little Lane, Upper Bucklebury, Reading RG7 6QX
| Today | See what it's worth now |
| 25 Nov 2025 | £970,000 |
| 11 Nov 2010 | £382,500 |
Ladywood, Long Grove, Upper Bucklebury, Reading RG7 6QS
| Today | See what it's worth now |
| 31 Oct 2025 | £1,350,000 |
| 30 Jul 2009 | £750,000 |
No other historical records.
Copperstones, Little Lane, Upper Bucklebury, Reading RG7 6QX
| Today | See what it's worth now |
| 22 Oct 2025 | £705,000 |
| 19 Aug 2010 | £375,000 |
Beech Cottage, Burdens Heath, Bucklebury, Reading RG7 6SX
| Today | See what it's worth now |
| 14 Aug 2025 | £1,085,000 |
No other historical records.
7, Mortons Lane, Upper Bucklebury, Reading RG7 6QQ
| Today | See what it's worth now |
| 27 Mar 2025 | £800,000 |
| 23 Jan 2015 | £550,000 |
13, Berrys Road, Upper Bucklebury, Reading RG7 6QL
| Today | See what it's worth now |
| 21 Mar 2025 | £425,000 |
No other historical records.
83a, Roundfield, Upper Bucklebury, Reading RG7 6RB
| Today | See what it's worth now |
| 28 Feb 2025 | £515,000 |
No other historical records.
36, Roundfield, Upper Bucklebury, Reading RG7 6RA
| Today | See what it's worth now |
| 28 Feb 2025 | £650,000 |
| 4 Dec 2015 | £280,000 |
No other historical records.
The Cleffon, Broad Lane, Upper Bucklebury, Reading RG7 6QJ

| Today | See what it's worth now |
| 28 Feb 2025 | £475,336 |
No other historical records.
Cornerways, Broad Lane, Upper Bucklebury, Reading RG7 6SQ
| Today | See what it's worth now |
| 21 Feb 2025 | £750,000 |
| 3 Feb 2025 | £750,000 |
No other historical records.
15, Berrys Road, Upper Bucklebury, Reading RG7 6QL

| Today | See what it's worth now |
| 29 Nov 2024 | £532,500 |
No other historical records.
5, Woodside Close, Upper Bucklebury, Reading RG7 6QR
| Today | See what it's worth now |
| 29 Nov 2024 | £747,500 |
| 9 Nov 2007 | £250,000 |
No other historical records.
2, Woodside Close, Upper Bucklebury, Reading RG7 6QR
| Today | See what it's worth now |
| 16 Oct 2024 | £175,000 |
No other historical records.
6a, Broad Lane, Upper Bucklebury, Reading RG7 6QJ
| Today | See what it's worth now |
| 26 Sep 2024 | £825,000 |
| 16 Jul 2010 | £500,000 |
10a, Broad Lane, Upper Bucklebury, Reading RG7 6QJ
| Today | See what it's worth now |
| 22 Aug 2024 | £962,500 |
| 29 Jul 2011 | £600,000 |
No other historical records.
Briar Cottage, Byles Green, Upper Bucklebury, Reading RG7 6SD

| Today | See what it's worth now |
| 21 Jun 2024 | £800,000 |
No other historical records.
71a, Roundfield, Upper Bucklebury, Reading RG7 6RB
| Today | See what it's worth now |
| 5 Jun 2024 | £380,000 |
| 21 Oct 2020 | £337,000 |
No other historical records.
Raemar, Little Lane, Upper Bucklebury, Reading RG7 6QX

| Today | See what it's worth now |
| 18 Apr 2024 | £725,000 |
| 22 Jan 2010 | £355,000 |
No other historical records.
5, Broad Lane, Upper Bucklebury, Reading RG7 6QH

| Today | See what it's worth now |
| 15 Feb 2024 | £482,500 |
| 25 Sep 1998 | £120,000 |
No other historical records.
57, Broad Lane, Upper Bucklebury, Reading RG7 6QH

| Today | See what it's worth now |
| 27 Oct 2023 | £775,000 |
| 19 Dec 2003 | £392,000 |
1, Blacklands Road, Upper Bucklebury, Reading RG7 6QP

| Today | See what it's worth now |
| 31 May 2023 | £472,500 |
| 29 Nov 2002 | £225,000 |
No other historical records.
Source Acknowledgement: © Crown copyright. England and Wales house price data is publicly available information produced by the HM Land Registry.This material was last updated on 9 July 2026. It covers the period from 1 January 1995 to 30 April 2026 and contains property transactions which have been registered during that period. Contains HM Land Registry data © Crown copyright and database right 2026. This data is licensed under the Open Government Licence v3.0.
Disclaimer: Rightmove.co.uk provides this HM Land Registry data "as is". The burden for fitness of the data relies completely with the user and is provided for informational purposes only. No warranty, express or implied, is given relating to the accuracy of content of the HM Land Registry data and Rightmove does not accept any liability for error or omission. If you have found an error with the data or need further information please contact HM Land Registry.
Permitted Use: Viewers of this Information are granted permission to access this Crown copyright material and to download it onto electronic, magnetic, optical or similar storage media provided that such activities are for private research, study or in-house use only. Any other use of the material requires the formal written permission of Land Registry which can be requested from us, and is subject to an additional licence and associated charge.
Rightmove takes no liability for your use of, or reliance on, Rightmove's Instant Valuation due to the limitations of our tracking tool listed here. Use of this tool is taken entirely at your own risk. All rights reserved.