
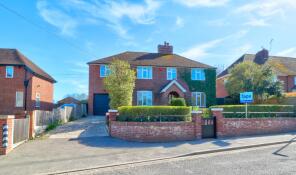
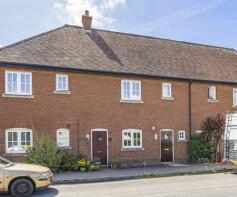
House Prices in Upper Goldstone
House prices in Upper Goldstone have an overall average of £363,214 over the last year.
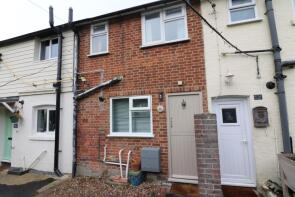
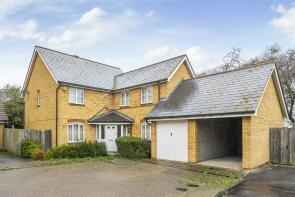
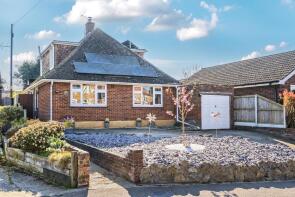
The majority of properties sold in Upper Goldstone during the last year were detached properties, selling for an average price of £459,083. Terraced properties sold for an average of £259,900, with semi-detached properties fetching £384,000.
Overall, the historical sold prices in Upper Goldstone over the last year were 7% down on the previous year and 14% down on the 2023 peak of £423,664.
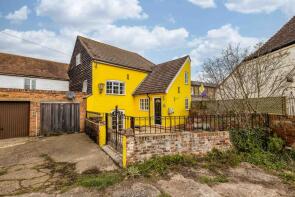
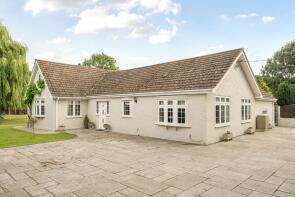
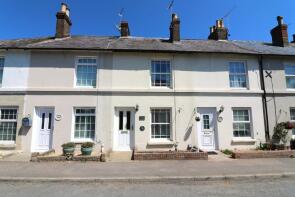
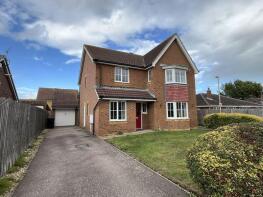
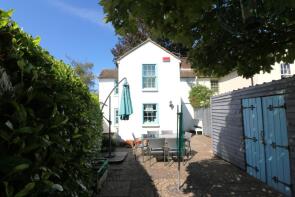
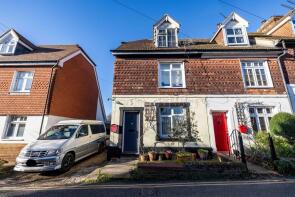
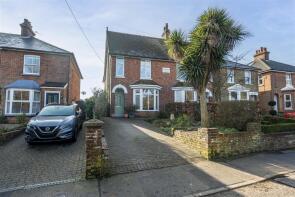
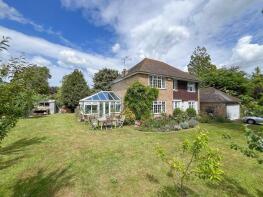
Properties Sold
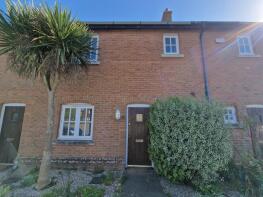
39, Sandwich Road, Ash CT3 2AF
| Today | See what it's worth now |
| 2 Apr 2026 | £142,000 |
No other historical records.
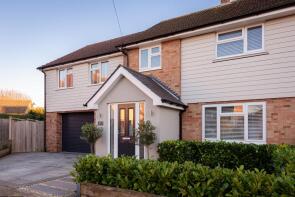
7, Chilton Gardens, Canterbury CT3 2HA
| Today | See what it's worth now |
| 1 Apr 2026 | £525,000 |
| 15 Apr 1996 | £58,000 |
No other historical records.
59, New Street, Canterbury CT3 2BL
| Today | See what it's worth now |
| 27 Mar 2026 | £490,000 |
| 15 Jun 2020 | £450,000 |
49, Glebelands, Canterbury CT3 2HY
| Today | See what it's worth now |
| 13 Feb 2026 | £295,000 |
| 14 Dec 2017 | £225,000 |
No other historical records.
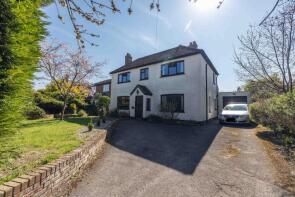
Brewery House, New Street, Canterbury CT3 2BH
| Today | See what it's worth now |
| 28 Jan 2026 | £300,000 |
| 3 Sep 2002 | £179,995 |
No other historical records.
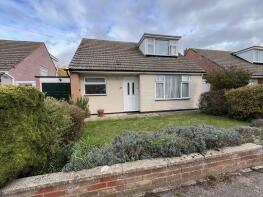
Blair Court, Westmarsh, Canterbury CT3 2LS
| Today | See what it's worth now |
| 21 Jan 2026 | £585,000 |
| 2 Apr 2015 | £430,000 |
100 April Cottage, The Street, Canterbury CT3 2AA
| Today | See what it's worth now |
| 9 Jan 2026 | £225,000 |
| 21 Mar 2019 | £185,000 |
84 Rose Farm, New Street, Canterbury CT3 2BN
| Today | See what it's worth now |
| 17 Dec 2025 | £420,000 |
| 29 Apr 2005 | £292,995 |
No other historical records.
23, Guilton, Canterbury CT3 2HL
| Today | See what it's worth now |
| 16 Dec 2025 | £627,000 |
| 19 Aug 2005 | £249,990 |
No other historical records.
31, New Street, Canterbury CT3 2BH
| Today | See what it's worth now |
| 10 Dec 2025 | £235,000 |
| 14 Mar 2022 | £252,500 |
17, Pippin Close, Canterbury CT3 2AU
| Today | See what it's worth now |
| 28 Nov 2025 | £425,000 |
| 31 Mar 2006 | £375,000 |
No other historical records.
51, Chequer Lane, Canterbury CT3 2AX
| Today | See what it's worth now |
| 14 Nov 2025 | £372,000 |
| 14 Dec 2017 | £275,000 |
3, Havelock Place, Canterbury CT3 2AB
| Today | See what it's worth now |
| 31 Oct 2025 | £263,000 |
| 28 Sep 2021 | £287,500 |
2, Queens Road, Canterbury CT3 2BG
| Today | See what it's worth now |
| 29 Oct 2025 | £280,000 |
| 22 Nov 2021 | £500,000 |
11, Guilton, Canterbury CT3 2HL
| Today | See what it's worth now |
| 15 Oct 2025 | £430,000 |
| 27 Jul 2017 | £308,000 |
92a, The Street, Canterbury CT3 2AA
| Today | See what it's worth now |
| 14 Oct 2025 | £600,000 |
| 27 Apr 2016 | £510,000 |
19, Glebelands, Canterbury CT3 2HY
| Today | See what it's worth now |
| 10 Oct 2025 | £220,000 |
| 2 Jul 2003 | £125,000 |
No other historical records.
57, Guilton, Ash CT3 2HR
| Today | See what it's worth now |
| 2 Oct 2025 | £255,000 |
No other historical records.
68, Glebelands, Ash CT3 2HZ
| Today | See what it's worth now |
| 25 Sep 2025 | £290,000 |
No other historical records.
Bermuda Triangle, Ware Road, Ash, Ware CT3 2NB
| Today | See what it's worth now |
| 18 Sep 2025 | £400,000 |
No other historical records.
Woodside, Durlock Road, Canterbury CT3 2HU
| Today | See what it's worth now |
| 29 Aug 2025 | £375,000 |
| 16 Mar 2021 | £345,000 |
No other historical records.
4, School House, The Street, Ash CT3 2AA
| Today | See what it's worth now |
| 21 Aug 2025 | £375,000 |
No other historical records.
7, White Post Gardens, Canterbury CT3 2AE
| Today | See what it's worth now |
| 14 Aug 2025 | £420,000 |
| 28 Jun 2021 | £300,000 |
No other historical records.
Source Acknowledgement: © Crown copyright. England and Wales house price data is publicly available information produced by the HM Land Registry.This material was last updated on 9 July 2026. It covers the period from 1 January 1995 to 30 April 2026 and contains property transactions which have been registered during that period. Contains HM Land Registry data © Crown copyright and database right 2026. This data is licensed under the Open Government Licence v3.0.
Disclaimer: Rightmove.co.uk provides this HM Land Registry data "as is". The burden for fitness of the data relies completely with the user and is provided for informational purposes only. No warranty, express or implied, is given relating to the accuracy of content of the HM Land Registry data and Rightmove does not accept any liability for error or omission. If you have found an error with the data or need further information please contact HM Land Registry.
Permitted Use: Viewers of this Information are granted permission to access this Crown copyright material and to download it onto electronic, magnetic, optical or similar storage media provided that such activities are for private research, study or in-house use only. Any other use of the material requires the formal written permission of Land Registry which can be requested from us, and is subject to an additional licence and associated charge.
Rightmove takes no liability for your use of, or reliance on, Rightmove's Instant Valuation due to the limitations of our tracking tool listed here. Use of this tool is taken entirely at your own risk. All rights reserved.