
House Prices in Upper Hambleton
House prices in Upper Hambleton have an overall average of £538,488 over the last year.
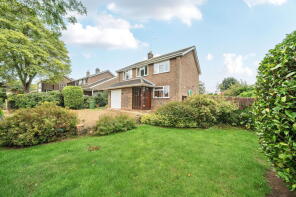
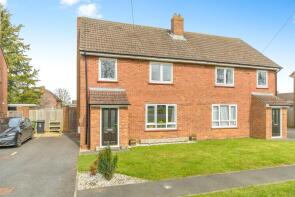
The majority of properties sold in Upper Hambleton during the last year were detached properties, selling for an average price of £787,079. Semi-detached properties sold for an average of £307,667, with terraced properties fetching £328,333.
Overall, the historical sold prices in Upper Hambleton over the last year were 13% down on the previous year and 9% down on the 2023 peak of £590,500.
Properties Sold
1, Deweys Close, Oakham LE15 8JW
| Today | See what it's worth now |
| 31 Mar 2026 | £255,000 |
| 31 Jul 2008 | £143,000 |
No other historical records.
6, Seaton Road, Barrowden LE15 8EN
| Today | See what it's worth now |
| 9 Mar 2026 | £335,000 |
No other historical records.
6 Lodore, Church Street, Oakham LE15 8PN
| Today | See what it's worth now |
| 2 Mar 2026 | £950,000 |
| 9 Mar 2022 | £430,000 |
April House, Top Street, Exton LE15 8BB
| Today | See what it's worth now |
| 27 Feb 2026 | £925,000 |
No other historical records.
Lilac Cottage, Oakham Road, Oakham LE15 8TL
| Today | See what it's worth now |
| 25 Feb 2026 | £1,335,000 |
| 30 Aug 2018 | £640,000 |
No other historical records.
9, North Luffenham Road, Oakham LE15 8NP
| Today | See what it's worth now |
| 30 Jan 2026 | £450,000 |
| 16 Feb 1996 | £110,000 |
No other historical records.
Cedar Cottage, Wing Road, Oakham LE15 8SZ
| Today | See what it's worth now |
| 9 Jan 2026 | £675,000 |
| 19 Aug 2005 | £387,500 |
No other historical records.
2, School Lane, Oakham LE15 8PQ
| Today | See what it's worth now |
| 2 Jan 2026 | £545,000 |
| 17 Apr 2008 | £305,000 |
No other historical records.
5, Windermere Road, Oakham LE15 8HT
| Today | See what it's worth now |
| 19 Dec 2025 | £250,000 |
| 4 Dec 2020 | £186,000 |
No other historical records.
Courtyard Cottage, Blacksmiths Lane, Oakham LE15 8AJ

| Today | See what it's worth now |
| 15 Dec 2025 | £325,000 |
| 23 Apr 2021 | £264,000 |
No other historical records.
12, Sycamore Road, Oakham LE15 8JL
| Today | See what it's worth now |
| 28 Nov 2025 | £335,000 |
| 21 Oct 2005 | £183,500 |
5, Pinfold Lane, Oakham LE15 8NR
| Today | See what it's worth now |
| 28 Nov 2025 | £212,500 |
| 5 Aug 2019 | £155,000 |
10, Orchard Close, Oakham LE15 8AG

| Today | See what it's worth now |
| 26 Nov 2025 | £950,000 |
| 12 Jan 2007 | £695,000 |
4, Glaston Road, Oakham LE15 8RU
| Today | See what it's worth now |
| 20 Nov 2025 | £293,000 |
| 10 Oct 2011 | £200,000 |
No other historical records.
35, Morcott Road, Oakham LE15 8SA

| Today | See what it's worth now |
| 20 Nov 2025 | £350,000 |
| 29 Sep 2023 | £325,000 |
10, Loves Lane, Oakham LE15 8PP

| Today | See what it's worth now |
| 7 Nov 2025 | £310,000 |
| 11 Jun 2021 | £233,000 |
20 The Ashes, Knossington Road, Oakham LE15 8QX
| Today | See what it's worth now |
| 5 Nov 2025 | £925,000 |
| 17 Feb 2011 | £535,000 |
9, Main Street, Oakham LE15 8LT
| Today | See what it's worth now |
| 31 Oct 2025 | £260,000 |
| 3 Jan 2017 | £275,000 |
8, Highfield Cottages, Stamford Road, Oakham LE15 8NU
| Today | See what it's worth now |
| 31 Oct 2025 | £342,500 |
| 22 Jan 2021 | £240,000 |
No other historical records.
St Andrews House, Lyndon Road, Oakham LE15 8TJ
| Today | See what it's worth now |
| 28 Oct 2025 | £1,490,000 |
| 26 Jan 2010 | £840,000 |
No other historical records.
Wheelgate, Wakerley Road, Barrowden LE15 8EP
| Today | See what it's worth now |
| 15 Oct 2025 | £682,000 |
No other historical records.
4 Ivy House, Hey Court, Oakham LE15 8FF
| Today | See what it's worth now |
| 15 Oct 2025 | £625,000 |
| 10 Dec 2019 | £475,000 |
2, Old School Close, Oakham LE15 8LG
| Today | See what it's worth now |
| 8 Oct 2025 | £235,000 |
| 16 Nov 2001 | £149,950 |
Source Acknowledgement: © Crown copyright. England and Wales house price data is publicly available information produced by the HM Land Registry.This material was last updated on 9 July 2026. It covers the period from 1 January 1995 to 30 April 2026 and contains property transactions which have been registered during that period. Contains HM Land Registry data © Crown copyright and database right 2026. This data is licensed under the Open Government Licence v3.0.
Disclaimer: Rightmove.co.uk provides this HM Land Registry data "as is". The burden for fitness of the data relies completely with the user and is provided for informational purposes only. No warranty, express or implied, is given relating to the accuracy of content of the HM Land Registry data and Rightmove does not accept any liability for error or omission. If you have found an error with the data or need further information please contact HM Land Registry.
Permitted Use: Viewers of this Information are granted permission to access this Crown copyright material and to download it onto electronic, magnetic, optical or similar storage media provided that such activities are for private research, study or in-house use only. Any other use of the material requires the formal written permission of Land Registry which can be requested from us, and is subject to an additional licence and associated charge.
Rightmove takes no liability for your use of, or reliance on, Rightmove's Instant Valuation due to the limitations of our tracking tool listed here. Use of this tool is taken entirely at your own risk. All rights reserved.