
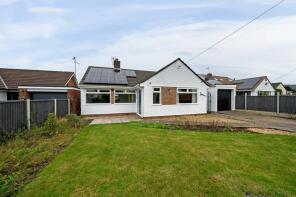
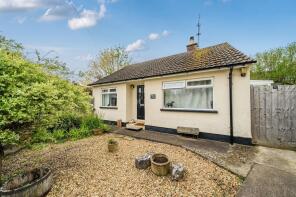
House Prices in Upper Langford
House prices in Upper Langford have an overall average of £429,197 over the last year.
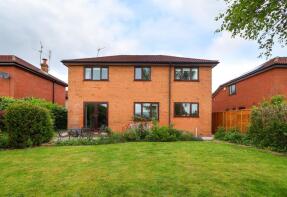
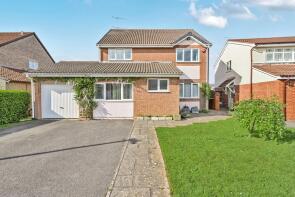
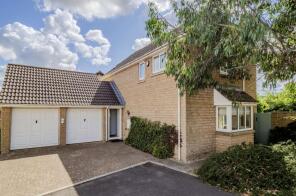
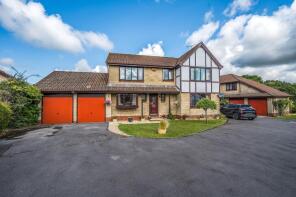
The majority of properties sold in Upper Langford during the last year were detached properties, selling for an average price of £513,759. Semi-detached properties sold for an average of £325,180, with terraced properties fetching £252,357.
Overall, the historical sold prices in Upper Langford over the last year were 1% down on the previous year and 15% down on the 2023 peak of £503,424.
Properties Sold
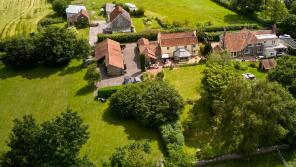
Littlemor, Chapel Hill, Bristol BS40 5NJ
| Today | See what it's worth now |
| 6 Mar 2026 | £695,000 |
| 29 Nov 2024 | £775,000 |
17, The Glebe, Bristol BS40 5LX

| Today | See what it's worth now |
| 6 Mar 2026 | £255,000 |
| 23 Oct 2020 | £240,000 |
1, Butts Batch, Wrington BS40 5LN
| Today | See what it's worth now |
| 5 Mar 2026 | £770,000 |
No other historical records.
Koz E Kot, West Hay Road, Bristol BS40 5NW
| Today | See what it's worth now |
| 3 Mar 2026 | £445,000 |
| 21 Jun 1996 | £52,500 |
No other historical records.
12, The Glebe, Bristol BS40 5LX
| Today | See what it's worth now |
| 27 Feb 2026 | £182,000 |
| 9 Aug 2005 | £118,000 |
The Spinney, Ladywell, Bristol BS40 5LT

| Today | See what it's worth now |
| 17 Feb 2026 | £913,500 |
| 18 Mar 2020 | £730,000 |
10 Japonica, Pudding Pie Close, Bristol BS40 5EN
| Today | See what it's worth now |
| 21 Jan 2026 | £400,000 |
| 5 Aug 2022 | £355,000 |
No other historical records.
141, Muntjac Road, Bristol BS40 5AG
| Today | See what it's worth now |
| 21 Jan 2026 | £450,000 |
| 18 Jan 2024 | £435,000 |
41, South Meadows, Bristol BS40 5PG
| Today | See what it's worth now |
| 19 Jan 2026 | £260,000 |
| 26 Feb 2021 | £235,000 |
No other historical records.
76, The Glebe, Bristol BS40 5LX
| Today | See what it's worth now |
| 14 Jan 2026 | £343,500 |
| 27 Nov 1998 | £89,950 |
7, Home Close, Bristol BS40 5PX
| Today | See what it's worth now |
| 13 Jan 2026 | £540,000 |
| 28 Apr 2006 | £332,000 |
No other historical records.
44, Broadoak Road, Bristol BS40 5HB
| Today | See what it's worth now |
| 9 Jan 2026 | £458,500 |
| 7 Oct 2016 | £350,000 |
Rose Cottage, Says Lane, Langford BS40 5EA
| Today | See what it's worth now |
| 7 Jan 2026 | £950,000 |
No other historical records.
61, Broadoak Road, Bristol BS40 5HD
| Today | See what it's worth now |
| 6 Jan 2026 | £390,000 |
| 24 May 2001 | £152,500 |
11, Home Close, Bristol BS40 5PX
| Today | See what it's worth now |
| 11 Dec 2025 | £600,000 |
| 27 Jul 2017 | £504,000 |
2, Birch Drive, Langford BS40 5HG

| Today | See what it's worth now |
| 8 Dec 2025 | £380,000 |
No other historical records.
24, Birch Drive, Bristol BS40 5HG
| Today | See what it's worth now |
| 8 Dec 2025 | £535,000 |
| 4 Oct 1996 | £122,000 |
No other historical records.
8, Old Bell Court, Bristol BS40 5QH
| Today | See what it's worth now |
| 28 Nov 2025 | £285,000 |
| 5 Nov 2020 | £295,000 |
3, Somerlea Stables, Langford Road, Bristol BS40 5HU
| Today | See what it's worth now |
| 14 Nov 2025 | £330,000 |
| 29 Mar 2018 | £265,000 |
75, Muntjac Road, Bristol BS40 5AF
| Today | See what it's worth now |
| 6 Nov 2025 | £435,000 |
| 27 Oct 2022 | £415,000 |
No other historical records.
Highway, Church Road, Bristol BS40 5SG
| Today | See what it's worth now |
| 5 Nov 2025 | £249,000 |
| 13 Jul 2006 | £182,500 |
Rose Cottage, Langford Road, Bristol BS40 5BW
| Today | See what it's worth now |
| 3 Nov 2025 | £355,000 |
| 15 Aug 2022 | £465,000 |
No other historical records.
14, Butts Batch, Bristol BS40 5LN
| Today | See what it's worth now |
| 31 Oct 2025 | £520,000 |
| 5 Jul 2019 | £275,000 |
No other historical records.
Source Acknowledgement: © Crown copyright. England and Wales house price data is publicly available information produced by the HM Land Registry.This material was last updated on 15 May 2026. It covers the period from 1 January 1995 to 31 March 2026 and contains property transactions which have been registered during that period. Contains HM Land Registry data © Crown copyright and database right 2026. This data is licensed under the Open Government Licence v3.0.
Disclaimer: Rightmove.co.uk provides this HM Land Registry data "as is". The burden for fitness of the data relies completely with the user and is provided for informational purposes only. No warranty, express or implied, is given relating to the accuracy of content of the HM Land Registry data and Rightmove does not accept any liability for error or omission. If you have found an error with the data or need further information please contact HM Land Registry.
Permitted Use: Viewers of this Information are granted permission to access this Crown copyright material and to download it onto electronic, magnetic, optical or similar storage media provided that such activities are for private research, study or in-house use only. Any other use of the material requires the formal written permission of Land Registry which can be requested from us, and is subject to an additional licence and associated charge.
Map data ©OpenStreetMap contributors.
Rightmove takes no liability for your use of, or reliance on, Rightmove's Instant Valuation due to the limitations of our tracking tool listed here. Use of this tool is taken entirely at your own risk. All rights reserved.