
House Prices in Upper Newbold
House prices in Upper Newbold have an overall average of £230,828 over the last year.
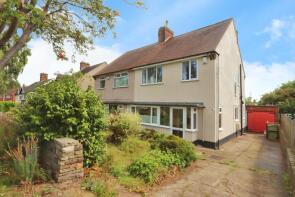
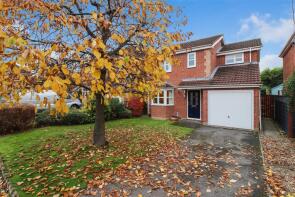
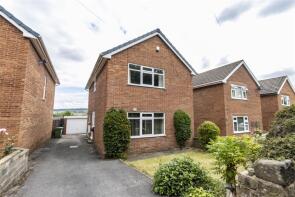
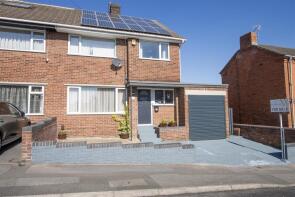
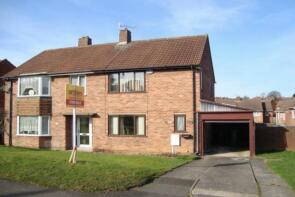
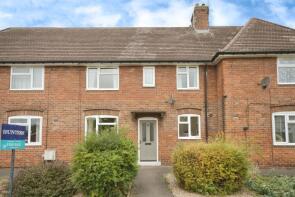
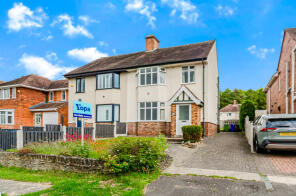
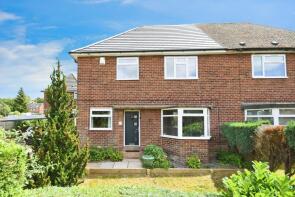
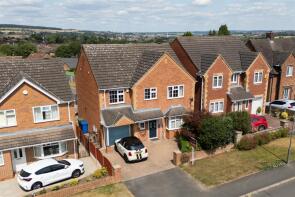
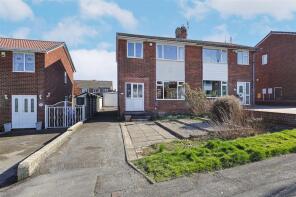
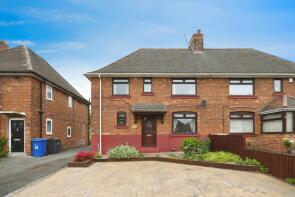
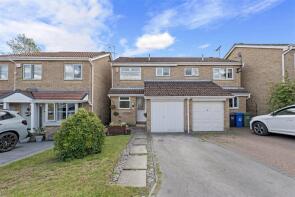
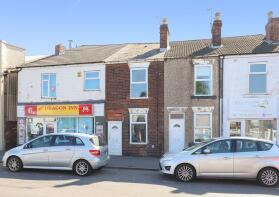
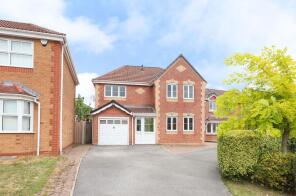
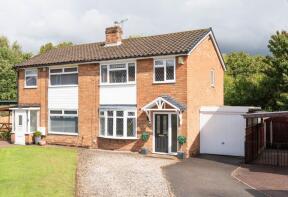
The majority of properties sold in Upper Newbold during the last year were semi-detached properties, selling for an average price of £194,026. Detached properties sold for an average of £352,750, with terraced properties fetching £152,500.
Overall, the historical sold prices in Upper Newbold over the last year were 9% up on the previous year and 17% up on the 2022 peak of £197,162.
Properties Sold
69, Littlemoor, Newbold S41 8QP
| Today | See what it's worth now |
| 24 Apr 2026 | £245,000 |
| 16 Feb 2024 | £195,000 |
No other historical records.
11, Ladywood Drive, Chesterfield S41 8XS
| Today | See what it's worth now |
| 7 Apr 2026 | £287,500 |
| 11 Aug 2006 | £185,000 |
33, Lancaster Road, Newbold S41 8TP
| Today | See what it's worth now |
| 27 Mar 2026 | £220,000 |
No other historical records.
90, Nelson Street, Chesterfield S41 8RT
| Today | See what it's worth now |
| 27 Mar 2026 | £190,000 |
| 26 Aug 1999 | £43,500 |
No other historical records.
36, Lansdowne Avenue, Chesterfield S41 8PL
| Today | See what it's worth now |
| 25 Mar 2026 | £405,000 |
| 27 Sep 2018 | £195,000 |
No other historical records.
37, Lindale Road, Chesterfield S41 8JH
| Today | See what it's worth now |
| 23 Mar 2026 | £215,000 |
| 16 Apr 2021 | £165,000 |
1, Ludham Gardens, Chesterfield S41 8SP
| Today | See what it's worth now |
| 19 Mar 2026 | £330,000 |
| 29 Aug 2007 | £150,700 |
No other historical records.
29, Thirlmere Road, Chesterfield S41 8EH

| Today | See what it's worth now |
| 19 Mar 2026 | £180,000 |
| 24 May 2019 | £130,000 |
106, Dunston Lane, Chesterfield S41 8HB

| Today | See what it's worth now |
| 10 Mar 2026 | £187,000 |
| 15 Sep 2008 | £125,000 |
No other historical records.
7, Kingswood Close, Chesterfield S41 8DE

| Today | See what it's worth now |
| 25 Feb 2026 | £185,000 |
| 21 Jan 2022 | £139,000 |
No other historical records.
150, Keswick Drive, Chesterfield S41 8HH
| Today | See what it's worth now |
| 23 Feb 2026 | £155,000 |
| 3 Jul 2013 | £101,500 |
No other historical records.
34, Wimborne Crescent, Chesterfield S41 8PS
| Today | See what it's worth now |
| 16 Feb 2026 | £127,500 |
| 25 Nov 2005 | £127,500 |
No other historical records.
49, Kirkstone Road, Chesterfield S41 8HE
| Today | See what it's worth now |
| 2 Feb 2026 | £150,000 |
| 24 Jan 2023 | £121,000 |
22, Occupation Road, Newbold S41 8TH
| Today | See what it's worth now |
| 30 Jan 2026 | £150,000 |
No other historical records.
43, Dunston Lane, Newbold S41 8EY
| Today | See what it's worth now |
| 27 Jan 2026 | £176,000 |
No other historical records.
15, Coniston Road, Chesterfield S41 8JE
| Today | See what it's worth now |
| 16 Jan 2026 | £210,000 |
| 24 Oct 1997 | £47,500 |
No other historical records.
20, Dukes Drive, Chesterfield S41 8QG
| Today | See what it's worth now |
| 14 Jan 2026 | £375,000 |
| 3 Jul 2009 | £233,000 |
27, Glenfield Crescent, Newbold S41 8SF
| Today | See what it's worth now |
| 19 Dec 2025 | £197,500 |
No other historical records.
20, Racecourse Road, Newbold S41 8TN
| Today | See what it's worth now |
| 16 Dec 2025 | £182,500 |
No other historical records.
30, Sherbourne Avenue, Chesterfield S41 8TL
| Today | See what it's worth now |
| 5 Dec 2025 | £165,000 |
| 2 May 2014 | £104,000 |
57, Dunston Lane, Newbold S41 8EZ

| Today | See what it's worth now |
| 28 Nov 2025 | £200,000 |
| 28 Mar 2025 | £120,000 |
No other historical records.
353, Sheffield Road, Chesterfield S41 8LQ
| Today | See what it's worth now |
| 25 Nov 2025 | £65,000 |
| 14 Nov 2003 | £38,000 |
4, Fieldview Place, Chesterfield S41 8WF
| Today | See what it's worth now |
| 21 Nov 2025 | £310,000 |
| 12 Apr 2007 | £263,500 |
Source Acknowledgement: © Crown copyright. England and Wales house price data is publicly available information produced by the HM Land Registry.This material was last updated on 9 July 2026. It covers the period from 1 January 1995 to 30 April 2026 and contains property transactions which have been registered during that period. Contains HM Land Registry data © Crown copyright and database right 2026. This data is licensed under the Open Government Licence v3.0.
Disclaimer: Rightmove.co.uk provides this HM Land Registry data "as is". The burden for fitness of the data relies completely with the user and is provided for informational purposes only. No warranty, express or implied, is given relating to the accuracy of content of the HM Land Registry data and Rightmove does not accept any liability for error or omission. If you have found an error with the data or need further information please contact HM Land Registry.
Permitted Use: Viewers of this Information are granted permission to access this Crown copyright material and to download it onto electronic, magnetic, optical or similar storage media provided that such activities are for private research, study or in-house use only. Any other use of the material requires the formal written permission of Land Registry which can be requested from us, and is subject to an additional licence and associated charge.
Rightmove takes no liability for your use of, or reliance on, Rightmove's Instant Valuation due to the limitations of our tracking tool listed here. Use of this tool is taken entirely at your own risk. All rights reserved.