
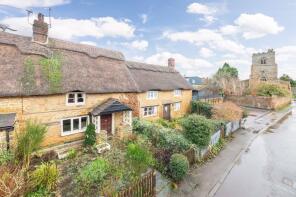
House Prices in Upper Wardington
House prices in Upper Wardington have an overall average of £409,333 over the last year.
The majority of properties sold in Upper Wardington during the last year were detached properties, selling for an average price of £483,659. Semi-detached properties sold for an average of £330,788, with terraced properties fetching £302,333.
Overall, the historical sold prices in Upper Wardington over the last year were 7% down on the previous year and 14% down on the 2023 peak of £478,557.
Properties Sold
12 Ashleigh, Chapel Lane, Banbury OX17 1RD
| Today | See what it's worth now |
| 27 Feb 2026 | £282,500 |
| 24 May 1996 | £60,000 |
8 Speculos Cottage, Hogg End, Banbury OX17 1JU
| Today | See what it's worth now |
| 27 Feb 2026 | £494,000 |
| 7 Jun 2024 | £502,000 |
8 High Beech, Vicarage Gardens, Banbury OX17 1PJ
| Today | See what it's worth now |
| 20 Feb 2026 | £735,000 |
| 25 Aug 2009 | £460,000 |
1 Highfield House, Chestnut Vale, Banbury OX17 1AW
| Today | See what it's worth now |
| 5 Feb 2026 | £628,000 |
| 16 Dec 2005 | £415,000 |
No other historical records.
1, Chapel Street, Banbury OX17 1DB
| Today | See what it's worth now |
| 27 Jan 2026 | £344,950 |
| 12 Jan 2007 | £238,000 |
Bryn, Crow Lane, Great Bourton OX17 1RL
| Today | See what it's worth now |
| 16 Jan 2026 | £590,000 |
No other historical records.
5 White Horses, Chapel Lane, Banbury OX17 1RD
| Today | See what it's worth now |
| 16 Jan 2026 | £275,000 |
| 16 Nov 2010 | £160,000 |
No other historical records.
Tree Tops, Station Road, Cropredy OX17 1PS
| Today | See what it's worth now |
| 14 Jan 2026 | £450,000 |
No other historical records.
10, Chestnut Road, Banbury OX17 1BG

| Today | See what it's worth now |
| 19 Dec 2025 | £375,000 |
| 6 Mar 2019 | £315,000 |
Dingles, Church Lane, Banbury OX17 1NQ
| Today | See what it's worth now |
| 19 Dec 2025 | £285,000 |
| 22 Jul 1997 | £120,000 |
Goviers Cottage, Banbury Road Through Wardington, Banbury OX17 1SA
| Today | See what it's worth now |
| 2 Dec 2025 | £280,000 |
| 30 Sep 2021 | £260,000 |
Squirrel Cottage, Mollington Road, Banbury OX17 1HU
| Today | See what it's worth now |
| 28 Nov 2025 | £411,700 |
| 28 Sep 2018 | £355,000 |
2, Church Close, Banbury OX17 1RS
| Today | See what it's worth now |
| 10 Nov 2025 | £345,000 |
| 7 Nov 2003 | £186,500 |
71, Bismore Road, Banbury OX16 1JN

| Today | See what it's worth now |
| 30 Oct 2025 | £375,000 |
| 30 Oct 2020 | £325,000 |
No other historical records.
21, Chestnut Road, Banbury OX17 1BG
| Today | See what it's worth now |
| 7 Oct 2025 | £400,000 |
| 9 Sep 2014 | £228,000 |
27, Bismore Road, Banbury OX16 1JN
| Today | See what it's worth now |
| 3 Oct 2025 | £418,000 |
| 30 Oct 2020 | £325,000 |
No other historical records.
11, Manor Close, Banbury OX17 1RA
| Today | See what it's worth now |
| 26 Sep 2025 | £325,000 |
| 11 Oct 2022 | £275,000 |
No other historical records.
14 Walnut Cottage, Main Street, Banbury OX17 1HN
| Today | See what it's worth now |
| 24 Sep 2025 | £635,000 |
| 29 Jun 2021 | £595,000 |
11, Uplands Rise, Banbury OX17 1RG
| Today | See what it's worth now |
| 24 Sep 2025 | £380,000 |
| 1 Nov 1996 | £94,500 |
No other historical records.
Vicarage Cottage, Banbury Road Through Wardington, Banbury OX17 1SA
| Today | See what it's worth now |
| 22 Sep 2025 | £575,000 |
| 15 Sep 2023 | £559,500 |
New Cottage, Spring Lane, Banbury OX17 1RJ
| Today | See what it's worth now |
| 5 Sep 2025 | £300,000 |
| 1 Dec 2023 | £265,000 |
5, Valley View, Banbury OX17 1QJ

| Today | See what it's worth now |
| 22 Aug 2025 | £482,000 |
| 15 Dec 2006 | £224,000 |
4, Valley View, Banbury OX17 1QJ
| Today | See what it's worth now |
| 22 Aug 2025 | £450,000 |
| 31 Jul 2017 | £250,000 |
No other historical records.

Source Acknowledgement: © Crown copyright. England and Wales house price data is publicly available information produced by the HM Land Registry.This material was last updated on 9 July 2026. It covers the period from 1 January 1995 to 30 April 2026 and contains property transactions which have been registered during that period. Contains HM Land Registry data © Crown copyright and database right 2026. This data is licensed under the Open Government Licence v3.0.
Disclaimer: Rightmove.co.uk provides this HM Land Registry data "as is". The burden for fitness of the data relies completely with the user and is provided for informational purposes only. No warranty, express or implied, is given relating to the accuracy of content of the HM Land Registry data and Rightmove does not accept any liability for error or omission. If you have found an error with the data or need further information please contact HM Land Registry.
Permitted Use: Viewers of this Information are granted permission to access this Crown copyright material and to download it onto electronic, magnetic, optical or similar storage media provided that such activities are for private research, study or in-house use only. Any other use of the material requires the formal written permission of Land Registry which can be requested from us, and is subject to an additional licence and associated charge.
Rightmove takes no liability for your use of, or reliance on, Rightmove's Instant Valuation due to the limitations of our tracking tool listed here. Use of this tool is taken entirely at your own risk. All rights reserved.