
House Prices in Uxbridge Common
House prices in Uxbridge Common have an overall average of £465,170 over the last year.
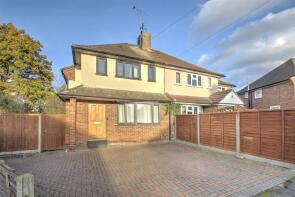
The majority of properties sold in Uxbridge Common during the last year were semi-detached properties, selling for an average price of £540,482. Flats sold for an average of £255,454, with terraced properties fetching £476,342.
Overall, the historical sold prices in Uxbridge Common over the last year were 1% up on the previous year and 3% up on the 2022 peak of £451,963.
Properties Sold
7, Bartram Close, Uxbridge UB8 3AX


| Today | See what it's worth now |
| 20 Jun 2025 | £245,000 |
| 4 Apr 2001 | £82,000 |
24, Campion Close, Uxbridge UB8 3PY
| Today | See what it's worth now |
| 3 Jun 2025 | £475,000 |
| 28 Jun 2013 | £230,000 |
No other historical records.
21, White Heart Avenue, Uxbridge UB8 3EP
| Today | See what it's worth now |
| 16 May 2025 | £440,000 |
| 16 Nov 2018 | £456,000 |
No other historical records.
47, Orchard Drive, Uxbridge UB8 3AF
| Today | See what it's worth now |
| 9 May 2025 | £800,000 |
| 23 Feb 2015 | £560,000 |
32, Goulds Green, Uxbridge UB8 3DG
| Today | See what it's worth now |
| 11 Apr 2025 | £460,000 |
| 30 Aug 1996 | £88,000 |
No other historical records.
35, Pinewood Avenue, Uxbridge UB8 3LW
| Today | See what it's worth now |
| 31 Mar 2025 | £245,000 |
| 13 Apr 2006 | £166,000 |
2g, Church Road, Uxbridge UB8 3NA
| Today | See what it's worth now |
| 31 Mar 2025 | £535,000 |
| 27 Nov 2020 | £575,000 |
No other historical records.
7a, Lonsdale Close, Uxbridge UB8 3BY
| Today | See what it's worth now |
| 31 Mar 2025 | £332,500 |
No other historical records.
24 Millscroft, Clayton Way, Uxbridge UB8 3AL

| Today | See what it's worth now |
| 28 Mar 2025 | £590,000 |
| 3 Nov 2016 | £460,000 |
16, Pinewood Avenue, Uxbridge UB8 3LW

| Today | See what it's worth now |
| 28 Mar 2025 | £85,500 |
| 14 Mar 1997 | £15,000 |
No other historical records.
4, Colham Road, Uxbridge UB8 3WQ

| Today | See what it's worth now |
| 28 Mar 2025 | £315,000 |
| 6 Apr 2001 | £127,835 |
No other historical records.
68, Collingwood Road, Uxbridge UB8 3EL
| Today | See what it's worth now |
| 27 Mar 2025 | £518,000 |
No other historical records.
50, Hambledon Close, Uxbridge UB8 3UD
| Today | See what it's worth now |
| 27 Mar 2025 | £86,000 |
| 19 Jul 2013 | £121,000 |
51, Dellfield Crescent, Uxbridge UB8 2EU
| Today | See what it's worth now |
| 26 Mar 2025 | £570,000 |
| 23 Apr 1999 | £105,000 |
No other historical records.
55, Clarkes Drive, Uxbridge UB8 3UJ
| Today | See what it's worth now |
| 24 Mar 2025 | £160,000 |
| 24 Mar 2017 | £160,000 |
38, Arklay Close, Uxbridge UB8 3WP
| Today | See what it's worth now |
| 21 Mar 2025 | £550,000 |
| 22 May 2008 | £360,000 |
No other historical records.
20, Perry Close, Uxbridge UB8 3HR

| Today | See what it's worth now |
| 18 Mar 2025 | £200,000 |
| 5 Oct 2007 | £156,000 |
120, St Peter's Road, Uxbridge UB8 3SD
| Today | See what it's worth now |
| 14 Mar 2025 | £320,000 |
| 8 Jul 2010 | £180,000 |
20, Nine Elms Close, Uxbridge UB8 3TN
| Today | See what it's worth now |
| 14 Mar 2025 | £585,000 |
| 2 Oct 2020 | £515,000 |
No other historical records.
47, Morello Avenue, Uxbridge UB8 3ES
| Today | See what it's worth now |
| 12 Mar 2025 | £610,000 |
| 30 May 2002 | £174,000 |
No other historical records.
4, Nine Elms Close, Uxbridge UB8 3TN
| Today | See what it's worth now |
| 10 Mar 2025 | £640,000 |
No other historical records.
10, Lees Road, Uxbridge UB8 3AS
| Today | See what it's worth now |
| 4 Mar 2025 | £725,000 |
No other historical records.
61, Dickens Avenue, Uxbridge UB8 3DN
| Today | See what it's worth now |
| 28 Feb 2025 | £585,000 |
| 10 Sep 2001 | £138,500 |
No other historical records.
46, Chapel Lane, Uxbridge UB8 3DS
| Today | See what it's worth now |
| 28 Feb 2025 | £318,000 |
| 6 Jun 2000 | £108,000 |
No other historical records.
11, Bourn Avenue, Uxbridge UB8 3AR
| Today | See what it's worth now |
| 26 Feb 2025 | £480,000 |
| 5 Apr 2019 | £367,500 |
No other historical records.
Get ready with a Mortgage in Principle
- Personalised result in just 20 minutes
- Find out how much you can borrow
- Get viewings faster with agents
- No impact on your credit score
What's your property worth?
Source Acknowledgement: © Crown copyright. England and Wales house price data is publicly available information produced by the HM Land Registry.This material was last updated on 6 August 2025. It covers the period from 1 January 1995 to 30 June 2025 and contains property transactions which have been registered during that period. Contains HM Land Registry data © Crown copyright and database right 2025. This data is licensed under the Open Government Licence v3.0.
Disclaimer: Rightmove.co.uk provides this HM Land Registry data "as is". The burden for fitness of the data relies completely with the user and is provided for informational purposes only. No warranty, express or implied, is given relating to the accuracy of content of the HM Land Registry data and Rightmove does not accept any liability for error or omission. If you have found an error with the data or need further information please contact HM Land Registry.
Permitted Use: Viewers of this Information are granted permission to access this Crown copyright material and to download it onto electronic, magnetic, optical or similar storage media provided that such activities are for private research, study or in-house use only. Any other use of the material requires the formal written permission of Land Registry which can be requested from us, and is subject to an additional licence and associated charge.
Map data ©OpenStreetMap contributors.
Rightmove takes no liability for your use of, or reliance on, Rightmove's Instant Valuation due to the limitations of our tracking tool listed here. Use of this tool is taken entirely at your own risk. All rights reserved.