
House Prices in Uxbridge
House prices in Uxbridge have an overall average of £543,400 over the last year.
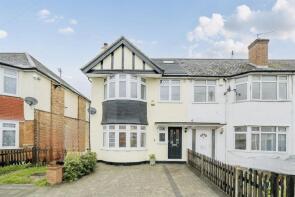
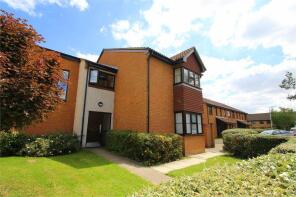
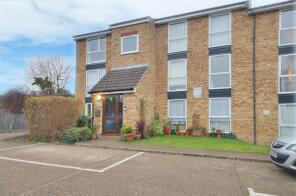
The majority of properties sold in Uxbridge during the last year were semi-detached properties, selling for an average price of £597,590. Terraced properties sold for an average of £491,432, with flats fetching £289,065.
Overall, the historical sold prices in Uxbridge over the last year were 5% up on the previous year and 5% up on the 2022 peak of £518,920.
Properties Sold
3, Queens Road, Uxbridge UB8 2NN
| Today | See what it's worth now |
| 27 Mar 2026 | £665,000 |
| 27 Apr 2022 | £670,000 |
No other historical records.
28, Manor Waye, Uxbridge UB8 2BQ
| Today | See what it's worth now |
| 26 Mar 2026 | £610,000 |
| 21 Jun 2013 | £310,000 |
29, Myddleton Road, Uxbridge UB8 2DN
| Today | See what it's worth now |
| 20 Mar 2026 | £567,500 |
| 10 Aug 2012 | £373,000 |
No other historical records.
88, Burnham Avenue, Uxbridge UB10 8RT

| Today | See what it's worth now |
| 20 Mar 2026 | £675,000 |
| 1 Aug 2013 | £354,000 |
42, Windsor Avenue, Uxbridge UB10 9AU
| Today | See what it's worth now |
| 20 Mar 2026 | £580,000 |
| 31 Jan 1997 | £88,950 |
No other historical records.
22, Squirrels Close, Uxbridge UB10 9NZ
| Today | See what it's worth now |
| 17 Mar 2026 | £915,000 |
| 14 Oct 2020 | £780,000 |
29, Lynhurst Road, Uxbridge UB10 9EE
| Today | See what it's worth now |
| 16 Mar 2026 | £536,000 |
| 28 May 2021 | £485,000 |
110, Hercies Road, Uxbridge UB10 9ND
| Today | See what it's worth now |
| 16 Mar 2026 | £840,000 |
| 10 May 2007 | £415,000 |
No other historical records.
124, Swakeleys Road, Uxbridge UB10 8BA
| Today | See what it's worth now |
| 16 Mar 2026 | £875,000 |
| 30 Apr 2009 | £340,000 |
No other historical records.
113, Granville Road, Uxbridge UB10 9AG
| Today | See what it's worth now |
| 16 Mar 2026 | £650,000 |
| 27 Jan 2014 | £324,250 |
No other historical records.
46, Clarkes Drive, Uxbridge UB8 3UJ
| Today | See what it's worth now |
| 13 Mar 2026 | £140,000 |
| 28 Jul 2014 | £117,500 |
No other historical records.
75, Pages Lane, Uxbridge UB8 1XT
| Today | See what it's worth now |
| 11 Mar 2026 | £300,000 |
| 10 Oct 2018 | £309,000 |
156, Aylsham Drive, Uxbridge UB10 8UE
| Today | See what it's worth now |
| 11 Mar 2026 | £260,000 |
| 23 Jan 2017 | £275,000 |
Flat 1, Lancaster House, Josiah Drive, Uxbridge UB10 8FF
| Today | See what it's worth now |
| 9 Mar 2026 | £225,000 |
| 25 Nov 2016 | £454,950 |
No other historical records.
41a, Rockingham Road, Uxbridge UB8 2TZ
| Today | See what it's worth now |
| 6 Mar 2026 | £250,000 |
No other historical records.
39, Shorediche Close, Uxbridge UB10 8EB
| Today | See what it's worth now |
| 6 Mar 2026 | £420,000 |
| 18 May 1998 | £89,950 |
No other historical records.
12, Martin Close, Uxbridge UB10 0SJ
| Today | See what it's worth now |
| 6 Mar 2026 | £316,000 |
| 27 Feb 2014 | £250,000 |
No other historical records.
36, Kings Mill Way, Uxbridge UB9 4BS
| Today | See what it's worth now |
| 6 Mar 2026 | £489,500 |
| 23 May 2017 | £483,000 |
45, Greatfields Drive, Uxbridge UB8 3QN

| Today | See what it's worth now |
| 4 Mar 2026 | £207,500 |
| 11 Mar 1998 | £39,500 |
7, Derwent Avenue, Uxbridge UB10 8HJ

| Today | See what it's worth now |
| 2 Mar 2026 | £1,100,000 |
| 10 Mar 2021 | £625,000 |
No other historical records.
The Old Manor House, Old Mill Close, Uxbridge UB8 2BS
| Today | See what it's worth now |
| 27 Feb 2026 | £910,000 |
No other historical records.
Flat 2, Hinds Court, Perkins Gardens, Uxbridge UB10 8FQ
| Today | See what it's worth now |
| 27 Feb 2026 | £277,000 |
| 23 Mar 2018 | £350,000 |
No other historical records.
13, Ashdown Road, Uxbridge UB10 0HY
| Today | See what it's worth now |
| 27 Feb 2026 | £580,000 |
No other historical records.
Source Acknowledgement: © Crown copyright. England and Wales house price data is publicly available information produced by the HM Land Registry.This material was last updated on 15 May 2026. It covers the period from 1 January 1995 to 31 March 2026 and contains property transactions which have been registered during that period. Contains HM Land Registry data © Crown copyright and database right 2026. This data is licensed under the Open Government Licence v3.0.
Disclaimer: Rightmove.co.uk provides this HM Land Registry data "as is". The burden for fitness of the data relies completely with the user and is provided for informational purposes only. No warranty, express or implied, is given relating to the accuracy of content of the HM Land Registry data and Rightmove does not accept any liability for error or omission. If you have found an error with the data or need further information please contact HM Land Registry.
Permitted Use: Viewers of this Information are granted permission to access this Crown copyright material and to download it onto electronic, magnetic, optical or similar storage media provided that such activities are for private research, study or in-house use only. Any other use of the material requires the formal written permission of Land Registry which can be requested from us, and is subject to an additional licence and associated charge.
Rightmove takes no liability for your use of, or reliance on, Rightmove's Instant Valuation due to the limitations of our tracking tool listed here. Use of this tool is taken entirely at your own risk. All rights reserved.