
House Prices in W9 1TS
House prices in W9 1TS have an overall average of £865,000 over the last year.
Overall, the historical sold prices in W9 1TS over the last year were 31% down on the 2014 peak of £1,250,000.
Properties Sold
Flat 8, Blomfield Court, Maida Vale, London W9 1TS

| Today | See what it's worth now |
| 27 Mar 2025 | £865,000 |
No other historical records.
Flat 16, Blomfield Court, Maida Vale, London W9 1TS
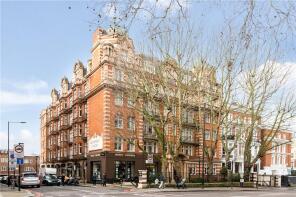
| Today | See what it's worth now |
| 31 Jul 2020 | £950,000 |
| 21 Jun 2000 | £220,000 |
No other historical records.
Flat 3, Blomfield Court, Maida Vale, London W9 1TS
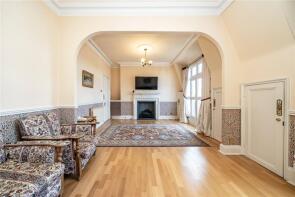
| Today | See what it's worth now |
| 26 Jul 2018 | £695,000 |
| 15 Jul 2016 | £600,000 |
No other historical records.
Flat 25, Blomfield Court, Maida Vale, London W9 1TS

| Today | See what it's worth now |
| 7 Nov 2016 | £1,350,000 |
| 30 Jun 2003 | £625,000 |
Flat 2, Blomfield Court, Maida Vale, London W9 1TS

| Today | See what it's worth now |
| 6 Jun 2016 | £990,000 |
| 6 Nov 2007 | £615,000 |
Flat 21, Blomfield Court, Maida Vale, London W9 1TS
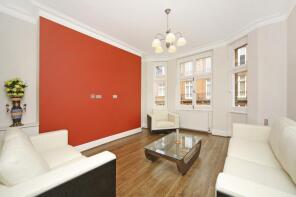
| Today | See what it's worth now |
| 14 Nov 2014 | £1,250,000 |
| 25 Oct 2000 | £300,000 |
No other historical records.
Flat 18, Blomfield Court, Maida Vale, London W9 1TS
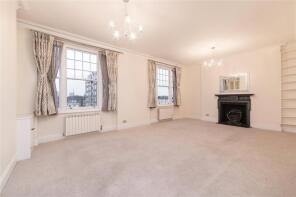
| Today | See what it's worth now |
| 13 Sep 2011 | £680,000 |
No other historical records.
Flat 6, Blomfield Court, Maida Vale, London W9 1TS

| Today | See what it's worth now |
| 27 Jul 2010 | £585,000 |
| 5 Oct 2007 | £535,000 |
No other historical records.
Flat 12, Blomfield Court, Maida Vale, London W9 1TS
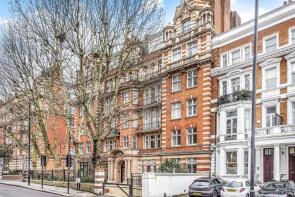
| Today | See what it's worth now |
| 7 Nov 2008 | £1,155,000 |
| 6 Sep 2007 | £850,000 |
No other historical records.
Flat 11, Blomfield Court, Maida Vale, London W9 1TS
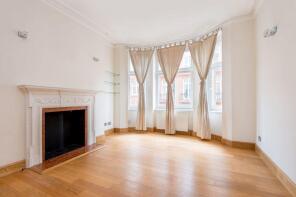
| Today | See what it's worth now |
| 25 Aug 2006 | £385,000 |
No other historical records.
Flat 1, Blomfield Court, Maida Vale, London W9 1TS
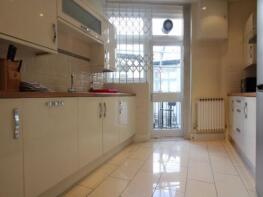
| Today | See what it's worth now |
| 3 Feb 2006 | £900,000 |
| 12 Jul 1999 | £385,000 |
Flat 24, Blomfield Court, Maida Vale, London W9 1TS

| Today | See what it's worth now |
| 31 Jul 2003 | £585,000 |
| 30 May 1997 | £345,000 |
Flat 7, Blomfield Court, Maida Vale, London W9 1TS

| Today | See what it's worth now |
| 30 Jul 2001 | £645,000 |
| 11 Nov 1999 | £325,000 |
No other historical records.
Flat 1a, Blomfield Court, Maida Vale, London W9 1TS

| Today | See what it's worth now |
| 26 Apr 2000 | £170,000 |
No other historical records.
Flat 22, Blomfield Court, Maida Vale, London W9 1TS
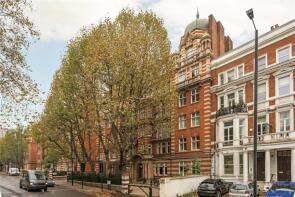
| Today | See what it's worth now |
| 12 Mar 1998 | £335,000 |
No other historical records.
Flat 4, Blomfield Court, Maida Vale, London W9 1TS

| Today | See what it's worth now |
| 1 Jul 1997 | £320,000 |
| 9 Dec 1996 | £201,500 |
No other historical records.
Flat 19, Blomfield Court, Maida Vale, London W9 1TS

| Today | See what it's worth now |
| 9 Feb 1996 | £175,000 |
| 24 Feb 1995 | £185,000 |
No other historical records.
Flat 15, Blomfield Court, Maida Vale, London W9 1TS

| Today | See what it's worth now |
| 10 Jan 1996 | £253,750 |
No other historical records.
Flat 14, Blomfield Court, Maida Vale, London W9 1TS

| Today | See what it's worth now |
| 20 Oct 1995 | £82,500 |
No other historical records.
Flat 26, Blomfield Court, Maida Vale, London W9 1TS
| Today | See what it's worth now |
| 7 Jul 1995 | £120,000 |
No other historical records.
Find out how much your property is worth
The following agents can provide you with a free, no-obligation valuation. Simply select the ones you'd like to hear from.
Sponsored
All featured agents have paid a fee to promote their valuation expertise.

CORE Residential
London

Knight Frank
Queens Park

Chancellors
St John's Wood

Foxtons
Maida Vale

Hamptons
Maida Vale

Winkworth
Maida Vale
Get ready with a Mortgage in Principle
- Personalised result in just 20 minutes
- Find out how much you can borrow
- Get viewings faster with agents
- No impact on your credit score
What's your property worth?
Source Acknowledgement: © Crown copyright. England and Wales house price data is publicly available information produced by the HM Land Registry.This material was last updated on 2 December 2025. It covers the period from 1 January 1995 to 31 October 2025 and contains property transactions which have been registered during that period. Contains HM Land Registry data © Crown copyright and database right 2026. This data is licensed under the Open Government Licence v3.0.
Disclaimer: Rightmove.co.uk provides this HM Land Registry data "as is". The burden for fitness of the data relies completely with the user and is provided for informational purposes only. No warranty, express or implied, is given relating to the accuracy of content of the HM Land Registry data and Rightmove does not accept any liability for error or omission. If you have found an error with the data or need further information please contact HM Land Registry.
Permitted Use: Viewers of this Information are granted permission to access this Crown copyright material and to download it onto electronic, magnetic, optical or similar storage media provided that such activities are for private research, study or in-house use only. Any other use of the material requires the formal written permission of Land Registry which can be requested from us, and is subject to an additional licence and associated charge.
Data on planning applications, home extensions and build costs is provided by Resi.co.uk. Planning data is calculated using the last 2 years of residential applications within the selected planning authority. Home extension data, such as build costs and project timelines, are calculated using approximately 9,000 architectural projects Resi has completed, and 23,500 builders quotes submitted via Resi's platform. Build costs are adjusted according to inflation rates to more accurately represent today's prices.
Map data ©OpenStreetMap contributors.
Rightmove takes no liability for your use of, or reliance on, Rightmove's Instant Valuation due to the limitations of our tracking tool listed here. Use of this tool is taken entirely at your own risk. All rights reserved.

