
House Prices in Waltham Forest
House prices in Waltham Forest have an overall average of £581,708 over the last year.
The majority of properties sold in Waltham Forest during the last year were terraced properties, selling for an average price of £702,213. Flats sold for an average of £401,680, with semi-detached properties fetching £732,429.
Overall, the historical sold prices in Waltham Forest over the last year were 3% up on the previous year and 9% up on the 2023 peak of £535,696.
Properties Sold
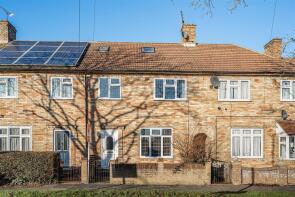
34, Longshaw Road, London E4 6LH
| Today | See today's value |
| 21 Aug 2026 | £560,000 |
| 13 Feb 1998 | £77,500 |
No other historical records.
Flat 3, 30a, Forest View, London E4 7AU
| Today | See today's value |
| 21 Aug 2026 | £375,000 |
| 11 Aug 2023 | £400,000 |
48, Westbury Road, London E17 6RH

| Today | See today's value |
| 19 Aug 2026 | £450,000 |
| 20 Feb 2026 | £534,000 |
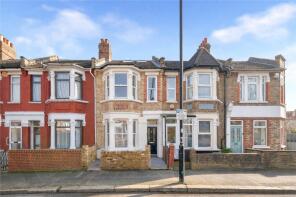
95, Boundary Road, London E17 8NQ
| Today | See today's value |
| 19 Aug 2026 | £735,500 |
| 26 Feb 2020 | £470,000 |
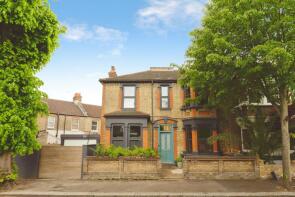
44, Woodville Road, London E11 3BH
| Today | See today's value |
| 17 Aug 2026 | £1,008,000 |
| 21 Jun 2021 | £745,000 |
No other historical records.
80, Westward Road, London E4 8LY

| Today | See today's value |
| 17 Aug 2026 | £330,000 |
| 11 Jun 2007 | £146,000 |
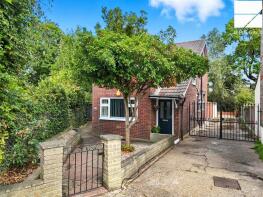
82, Wickham Road, London E4 9JR
| Today | See today's value |
| 15 Aug 2026 | £295,000 |
| 23 Mar 2001 | £99,000 |
No other historical records.
41, East View, London E4 9JA
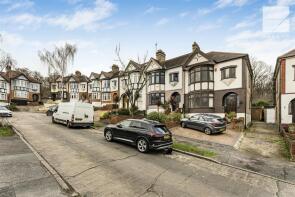
| Today | See today's value |
| 14 Aug 2026 | £750,000 |
| 27 Oct 1995 | £105,000 |
No other historical records.
7a, Hollybush Hill, Wanstead, London E11 1PP
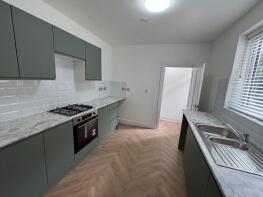
| Today | See today's value |
| 14 Aug 2026 | £350,000 |
| 14 Oct 2022 | £300,000 |
67, Cottenham Road, London E17 6RP
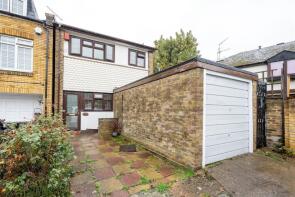
| Today | See today's value |
| 14 Aug 2026 | £628,000 |
| 30 Nov 2015 | £520,000 |
No other historical records.
4, Randolph Road, London E17 9NR
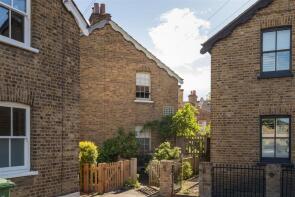
| Today | See today's value |
| 14 Aug 2026 | £900,000 |
| 23 Jan 2009 | £352,500 |
15, Burchell Road, London E10 5AY
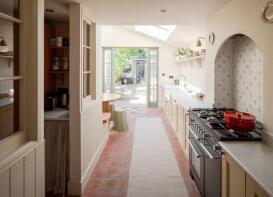
| Today | See today's value |
| 14 Aug 2026 | £800,000 |
| 24 Apr 2015 | £335,000 |
124, Millais Road, Leytonstone E11 4HA
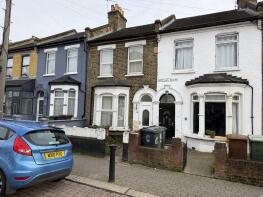
| Today | See today's value |
| 14 Aug 2026 | £560,000 |
No other historical records.
43, Lancaster Road, London E17 6AH
| Today | See today's value |
| 14 Aug 2026 | £900,000 |
| 20 Mar 2023 | £820,000 |
No other historical records.
22, 51 King Henry Lodge, Hall Lane, London E4 8HW

| Today | See today's value |
| 14 Aug 2026 | £360,000 |
| 15 Jan 2016 | £426,950 |
No other historical records.
39a, Selby Road, London E11 3LT
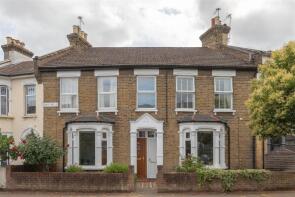
| Today | See today's value |
| 14 Aug 2026 | £528,000 |
| 26 Feb 2016 | £302,000 |
No other historical records.
Flat 2, 21, Grove Road, Walthamstow E17 9BL
| Today | See today's value |
| 14 Aug 2026 | £334,500 |
| 2 Feb 2006 | £160,000 |
21, Normanton Park, London E4 6HE
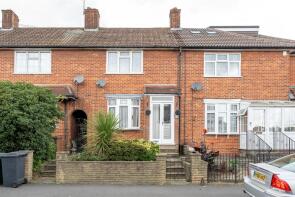
| Today | See today's value |
| 13 Aug 2026 | £450,000 |
| 1 Mar 2016 | £362,000 |
151, Green Pond Close, London E17 6EF
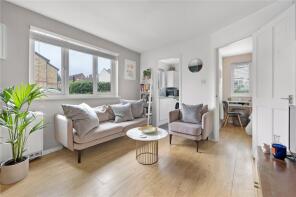
| Today | See today's value |
| 13 Aug 2026 | £260,000 |
| 10 Jun 2019 | £235,000 |
55, Orford Road, London E17 9NJ
| Today | See today's value |
| 13 Aug 2026 | £920,000 |
| 24 Oct 2017 | £790,000 |
6, Maida Avenue, London E4 7JN

| Today | See today's value |
| 12 Aug 2026 | £607,500 |
| 27 Sep 2018 | £480,000 |
33, Hampton Road, London E4 8NH
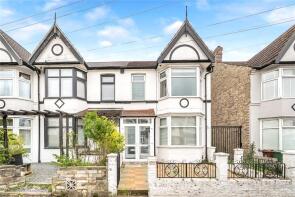
| Today | See today's value |
| 12 Aug 2026 | £540,000 |
| 8 Nov 2018 | £350,000 |
No other historical records.
9, Eastfield Road, London E17 3BA
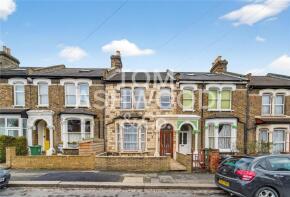
| Today | See today's value |
| 12 Aug 2026 | £810,000 |
| 31 Oct 1995 | £65,500 |
No other historical records.


Rightmove takes no liability for your use of, or reliance on, Rightmove's Instant Valuation due to the limitations of our tracking tool listed here. Use of this tool is taken entirely at your own risk. All rights reserved.