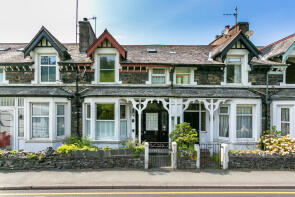
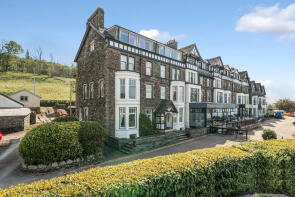
House Prices in Waterhead
Properties Sold
2, Lakes Gardens, Ambleside LA22 0DA

| Today | See what it's worth now |
| 1 Nov 2024 | £645,000 |
| 18 Dec 2020 | £580,000 |
No other historical records.
Swallowdale, Old Lake Road, Ambleside LA22 0AE
| Today | See what it's worth now |
| 14 Aug 2024 | £850,000 |
No other historical records.
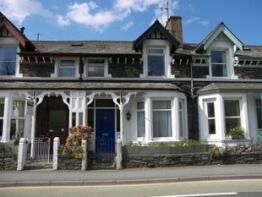
Dunelm, Old Lake Road, Ambleside LA22 0DH
| Today | See what it's worth now |
| 29 Jul 2024 | £650,000 |
| 10 Jun 1998 | £155,300 |
2, The Brandrith, Lake Road, Ambleside LA22 0DQ

| Today | See what it's worth now |
| 15 Mar 2024 | £370,000 |
| 30 May 2008 | £285,000 |
No other historical records.
Rosehill, Old Lake Road, Ambleside LA22 0DH

| Today | See what it's worth now |
| 24 Feb 2023 | £679,700 |
No other historical records.
Gale House, Low Gale, Ambleside LA22 0BB

| Today | See what it's worth now |
| 8 Aug 2022 | £899,437 |
No other historical records.
Gale Lodge Stables, Old Lake Road, Ambleside LA22 0AE

| Today | See what it's worth now |
| 11 Mar 2022 | £386,000 |
| 3 Nov 2017 | £250,000 |
10, Romney Grange, Waterhead, Ambleside LA22 0HD
| Today | See what it's worth now |
| 10 Feb 2022 | £600,000 |
| 23 Jul 2013 | £555,000 |
Waterhead Range Cottage, Lake Road, Ambleside LA22 0DS
| Today | See what it's worth now |
| 17 Dec 2021 | £525,000 |
No other historical records.
5, Lowfield, Old Lake Road, Ambleside LA22 0DH

| Today | See what it's worth now |
| 30 Jun 2021 | £430,000 |
| 22 Nov 2010 | £323,500 |
No other historical records.
Cobblestones, Old Lake Road, Ambleside LA22 0DH
| Today | See what it's worth now |
| 29 Jun 2021 | £875,000 |
| 15 Sep 2017 | £665,000 |
5, Waterhead Terrace, Ambleside LA22 0HA
| Today | See what it's worth now |
| 22 Jun 2021 | £386,500 |
| 5 May 2011 | £250,000 |
Low Fold Barn, Old Lake Road, Ambleside LA22 0DP

| Today | See what it's worth now |
| 18 May 2021 | £645,000 |
| 22 Jul 2002 | £155,000 |
No other historical records.
4, Lowfield, Old Lake Road, Ambleside LA22 0DH

| Today | See what it's worth now |
| 23 Apr 2021 | £340,000 |
| 23 Aug 2012 | £317,500 |
Loughrigg Hide, Lake Road, Ambleside LA22 0DN

| Today | See what it's worth now |
| 31 Mar 2021 | £240,000 |
| 15 Mar 2013 | £190,000 |
No other historical records.
2, Waterhead Range, Lake Road, Ambleside LA22 0DS

| Today | See what it's worth now |
| 24 Feb 2021 | £300,000 |
| 28 Feb 1997 | £76,000 |
No other historical records.
6, Waterhead Terrace, Ambleside LA22 0HA
| Today | See what it's worth now |
| 13 Nov 2020 | £351,000 |
| 2 Mar 2011 | £285,000 |
1, The Brandrith, Lake Road, Ambleside LA22 0DQ
| Today | See what it's worth now |
| 25 Mar 2019 | £275,000 |
| 23 Feb 2007 | £280,000 |
No other historical records.
2, Mciver Close, Mcivers Lane, Waterhead, Ambleside LA22 0DX
| Today | See what it's worth now |
| 21 Sep 2018 | £410,000 |
| 25 Oct 2001 | £202,500 |
3, Lakelands, Ambleside LA22 0ET
| Today | See what it's worth now |
| 7 Dec 2017 | £285,000 |
No other historical records.
8, Waterhead Terrace, Ambleside LA22 0HA
| Today | See what it's worth now |
| 30 Oct 2017 | £260,000 |
No other historical records.
Brackenholme, Old Lake Road, Ambleside LA22 0DH
| Today | See what it's worth now |
| 12 Oct 2017 | £635,000 |
| 31 Mar 2015 | £450,000 |
No other historical records.
2, Lakelands, Ambleside LA22 0ET
| Today | See what it's worth now |
| 30 Aug 2017 | £260,000 |
No other historical records.
Source Acknowledgement: © Crown copyright. England and Wales house price data is publicly available information produced by the HM Land Registry.This material was last updated on 15 May 2026. It covers the period from 1 January 1995 to 31 March 2026 and contains property transactions which have been registered during that period. Contains HM Land Registry data © Crown copyright and database right 2026. This data is licensed under the Open Government Licence v3.0.
Disclaimer: Rightmove.co.uk provides this HM Land Registry data "as is". The burden for fitness of the data relies completely with the user and is provided for informational purposes only. No warranty, express or implied, is given relating to the accuracy of content of the HM Land Registry data and Rightmove does not accept any liability for error or omission. If you have found an error with the data or need further information please contact HM Land Registry.
Permitted Use: Viewers of this Information are granted permission to access this Crown copyright material and to download it onto electronic, magnetic, optical or similar storage media provided that such activities are for private research, study or in-house use only. Any other use of the material requires the formal written permission of Land Registry which can be requested from us, and is subject to an additional licence and associated charge.
Map data ©OpenStreetMap contributors.
Rightmove takes no liability for your use of, or reliance on, Rightmove's Instant Valuation due to the limitations of our tracking tool listed here. Use of this tool is taken entirely at your own risk. All rights reserved.