
House Prices in Watts Common
House prices in Watts Common have an overall average of £412,071 over the last year.
The majority of properties sold in Watts Common during the last year were flats, selling for an average price of £237,166. Semi-detached properties sold for an average of £485,500, with detached properties fetching £597,744.
Overall, the historical sold prices in Watts Common over the last year were 3% down on the previous year and 5% down on the 2004 peak of £435,000.
Properties Sold
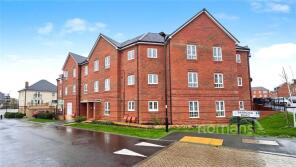
13, 1 Keller House, Barrosa Road, Wellesley, Aldershot GU11 4DR
| Today | See today's value |
| 28 Jul 2026 | £275,000 |
| 20 Dec 2022 | £288,950 |
No other historical records.
1, Oswald Street, Wellesley, Aldershot GU11 4AP

| Today | See today's value |
| 20 Jul 2026 | £260,000 |
| 31 Mar 2016 | £200,000 |
No other historical records.
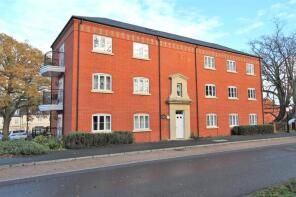
2, Elizabeth House, Scarlett's Road, Wellesley, Aldershot GU11 4AG
| Today | See today's value |
| 15 Jul 2026 | £80,000 |
| 19 Jun 2020 | £76,000 |
No other historical records.
12, Birch House, Exchange Close, Aldershot GU11 2FD

| Today | See today's value |
| 10 Jul 2026 | £200,000 |
| 15 Nov 2019 | £196,000 |
No other historical records.
18, Scarlett's Road, Wellesley, Aldershot GU11 4AE

| Today | See today's value |
| 9 Jul 2026 | £440,000 |
| 9 Jun 2017 | £378,995 |
No other historical records.
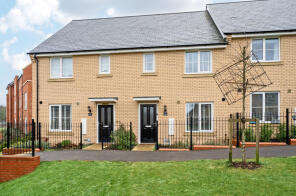
6, St Sebastian's Way, Wellesley, Aldershot GU11 4FN
| Today | See today's value |
| 8 Jul 2026 | £410,000 |
| 22 Aug 2023 | £425,000 |
No other historical records.
13, Parsons Close, Aldershot GU11 2EU

| Today | See today's value |
| 23 Jun 2026 | £200,000 |
| 31 Oct 2006 | £157,000 |
No other historical records.
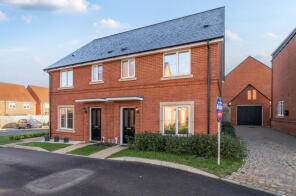
25, Stanhope Lines East, Wellesley, Aldershot GU11 4FE
| Today | See today's value |
| 3 Jun 2026 | £445,000 |
| 3 Nov 2023 | £452,000 |
No other historical records.
2, Kempt Lane, Wellesley, Aldershot GU11 4AU
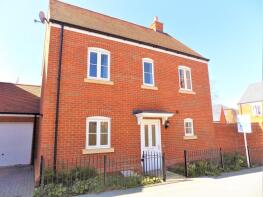
| Today | See today's value |
| 27 May 2026 | £455,000 |
| 28 Oct 2016 | £379,995 |
No other historical records.
5, Jerome Street, Wellesley, Aldershot GU11 4AR

| Today | See today's value |
| 26 May 2026 | £442,000 |
| 23 Oct 2017 | £374,995 |
No other historical records.
7, Birch House, Exchange Close, Aldershot GU11 2FD

| Today | See today's value |
| 30 Apr 2026 | £244,000 |
| 15 May 2020 | £240,000 |
No other historical records.
5, Parsons Close, Aldershot GU11 2EU

| Today | See today's value |
| 23 Apr 2026 | £210,000 |
| 28 Jan 2020 | £200,000 |
13, 15 Bowen House, Hospital Road, Wellesley, Aldershot GU11 4EH

| Today | See today's value |
| 30 Mar 2026 | £250,000 |
| 23 Feb 2021 | £260,000 |
No other historical records.
13, Hatt Street, Wellesley, Aldershot GU11 4AQ

| Today | See today's value |
| 4 Mar 2026 | £450,000 |
| 16 Dec 2016 | £324,950 |
No other historical records.
5, Hardinge Close, Wellesley, Aldershot GU11 4FB

| Today | See today's value |
| 3 Mar 2026 | £278,000 |
| 4 Jun 2024 | £270,000 |
No other historical records.
64, Hope Grant's Road, Wellesley, Aldershot GU11 4AN

| Today | See today's value |
| 13 Feb 2026 | £435,000 |
| 30 Jul 2021 | £410,000 |
No other historical records.
5, 70 Islander House, Montgomery Avenue, Wellesley, Aldershot GU11 4AY

| Today | See today's value |
| 6 Feb 2026 | £200,000 |
| 22 Mar 2019 | £227,500 |
No other historical records.
4, Birch House, Exchange Close, Aldershot GU11 2FD

| Today | See today's value |
| 19 Dec 2025 | £210,000 |
| 13 Aug 2019 | £192,500 |
No other historical records.
46, West Hope Grant's Road, Wellesley, Aldershot GU11 4BE

| Today | See today's value |
| 12 Dec 2025 | £515,000 |
| 17 Dec 2021 | £509,995 |
No other historical records.
14, Green Stone Close, Aldershot GU11 2HX
| Today | See today's value |
| 5 Dec 2025 | £535,000 |
No other historical records.
15, Moore Drive, Wellesley, Aldershot GU11 4AZ
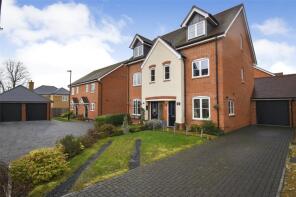
| Today | See today's value |
| 2 Dec 2025 | £510,000 |
| 13 Dec 2019 | £430,000 |
No other historical records.
12, Green Stone Close, Aldershot GU11 2HX
| Today | See today's value |
| 1 Dec 2025 | £545,000 |
No other historical records.
2, 18 Betts House, Fire Station Road, Wellesley, Aldershot GU11 4ER

| Today | See today's value |
| 28 Nov 2025 | £182,500 |
| 13 Mar 2020 | £215,000 |
No other historical records.
Rightmove takes no liability for your use of, or reliance on, Rightmove's Instant Valuation due to the limitations of our tracking tool listed here. Use of this tool is taken entirely at your own risk. All rights reserved.