
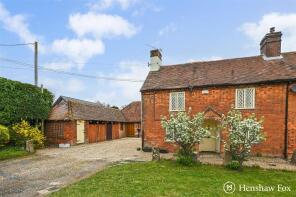
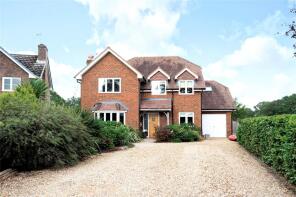
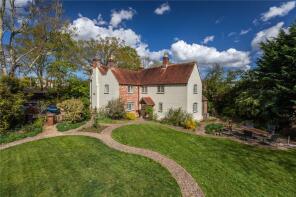
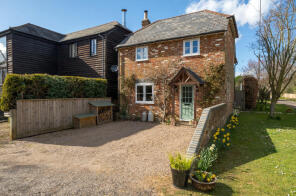
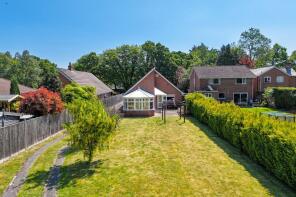
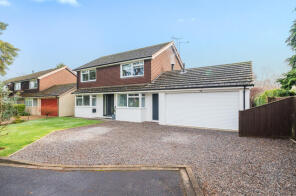
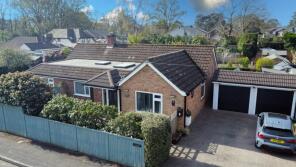
House Prices in Wellow Drove
House prices in Wellow Drove have an overall average of £725,280 over the last year.
The majority of properties sold in Wellow Drove during the last year were detached properties, selling for an average price of £857,492. Semi-detached properties sold for an average of £549,250, with terraced properties fetching £360,750.
Overall, the historical sold prices in Wellow Drove over the last year were 7% up on the previous year and 5% down on the 2021 peak of £763,800.
Properties Sold
7, Arun Way, West Wellow, Romsey SO51 6GT
| Today | See what it's worth now |
| 17 Apr 2026 | £560,000 |
| 9 Jun 2017 | £435,000 |
Kingfisher, Salisbury Road, Ower SO51 6AG
| Today | See what it's worth now |
| 2 Apr 2026 | £724,000 |
| 12 Sep 2008 | £426,000 |
The Hollies, Maurys Lane, West Wellow, Romsey SO51 6DB
| Today | See what it's worth now |
| 23 Mar 2026 | £700,000 |
| 14 Jul 2000 | £285,000 |
Chericot, Doctors Hill, Romsey SO51 6JX
| Today | See what it's worth now |
| 18 Mar 2026 | £1,140,000 |
| 20 Nov 2015 | £845,000 |
Daiquiri, Spouts Lane, West Wellow, Romsey SO51 6EL
| Today | See what it's worth now |
| 10 Mar 2026 | £1,250,000 |
| 18 Mar 2021 | £780,000 |
14, School Road, West Wellow, Romsey SO51 6AR
| Today | See what it's worth now |
| 5 Mar 2026 | £625,000 |
| 17 Dec 2009 | £440,000 |
No other historical records.
Gunsfield Lodge, Comptons Drive, Plaitford SO51 6ES

| Today | See what it's worth now |
| 17 Feb 2026 | £1,900,000 |
No other historical records.
12, Dunwood Court, Salisbury Road, Romsey SO51 6GR
| Today | See what it's worth now |
| 4 Feb 2026 | £177,500 |
| 1 Jul 2020 | £175,000 |
No other historical records.
53 Twin Oaks, Gurnays Mead, West Wellow, Romsey SO51 6BP
| Today | See what it's worth now |
| 20 Jan 2026 | £495,000 |
| 8 Apr 1997 | £133,000 |
No other historical records.
30, Barnes Close, West Wellow, Romsey SO51 6ET
| Today | See what it's worth now |
| 16 Jan 2026 | £455,000 |
| 4 Dec 2019 | £370,000 |
Warblers Cottage, Rowden Close, West Wellow SO51 6RF
| Today | See what it's worth now |
| 9 Jan 2026 | £395,000 |
No other historical records.
Lilac Lodge, Rowden Close, West Wellow SO51 6RF
| Today | See what it's worth now |
| 9 Jan 2026 | £562,000 |
No other historical records.
The Olde Oak, Maurys Lane, West Wellow, Romsey SO51 6DB
| Today | See what it's worth now |
| 18 Dec 2025 | £740,000 |
| 11 Dec 2020 | £740,000 |
No other historical records.
Forest View, Canada Road, West Wellow, Romsey SO51 6DD
| Today | See what it's worth now |
| 3 Dec 2025 | £1,691,300 |
| 22 Aug 2005 | £650,000 |
Gingernuts, Salisbury Road, West Wellow SO51 6BW
| Today | See what it's worth now |
| 25 Nov 2025 | £435,000 |
No other historical records.
Raglens, The Drove, West Wellow, Romsey SO51 6BT
| Today | See what it's worth now |
| 24 Nov 2025 | £520,000 |
| 30 Jun 2004 | £285,000 |
No other historical records.
Heatherlands, Salisbury Road, Romsey SO51 6EE
| Today | See what it's worth now |
| 21 Nov 2025 | £1,625,000 |
| 31 Aug 2010 | £560,000 |
Steplake Cottage, Wellow Wood Road, West Wellow, Romsey SO51 6EP
| Today | See what it's worth now |
| 20 Nov 2025 | £1,000,000 |
| 28 Apr 2000 | £390,000 |
No other historical records.
13 Meadowview Cottage, Romsey Road, Romsey SO51 6AF
| Today | See what it's worth now |
| 13 Nov 2025 | £730,000 |
| 8 Jan 2010 | £500,000 |
Fairview, The Drove, West Wellow, Romsey SO51 6BT
| Today | See what it's worth now |
| 7 Nov 2025 | £795,000 |
| 8 Sep 2005 | £309,000 |
No other historical records.
Thornegate, Romsey Road, West Wellow, Romsey SO51 6ED
| Today | See what it's worth now |
| 27 Oct 2025 | £1,100,000 |
| 29 Feb 2008 | £840,000 |
Broxmore Farm Cottage, Bunny Lane, Romsey SO51 6FS
| Today | See what it's worth now |
| 14 Oct 2025 | £630,000 |
| 20 Apr 2022 | £580,000 |
Karingal, Whinwhistle Road, East Wellow, Romsey SO51 6BN
| Today | See what it's worth now |
| 13 Oct 2025 | £680,000 |
No other historical records.
Source Acknowledgement: © Crown copyright. England and Wales house price data is publicly available information produced by the HM Land Registry.This material was last updated on 9 July 2026. It covers the period from 1 January 1995 to 30 April 2026 and contains property transactions which have been registered during that period. Contains HM Land Registry data © Crown copyright and database right 2026. This data is licensed under the Open Government Licence v3.0.
Disclaimer: Rightmove.co.uk provides this HM Land Registry data "as is". The burden for fitness of the data relies completely with the user and is provided for informational purposes only. No warranty, express or implied, is given relating to the accuracy of content of the HM Land Registry data and Rightmove does not accept any liability for error or omission. If you have found an error with the data or need further information please contact HM Land Registry.
Permitted Use: Viewers of this Information are granted permission to access this Crown copyright material and to download it onto electronic, magnetic, optical or similar storage media provided that such activities are for private research, study or in-house use only. Any other use of the material requires the formal written permission of Land Registry which can be requested from us, and is subject to an additional licence and associated charge.
Rightmove takes no liability for your use of, or reliance on, Rightmove's Instant Valuation due to the limitations of our tracking tool listed here. Use of this tool is taken entirely at your own risk. All rights reserved.