
House Prices in Westbrook
House prices in Westbrook have an overall average of £352,062 over the last year.
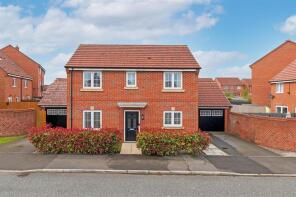
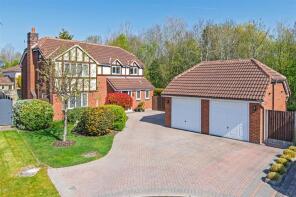
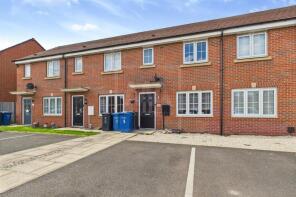
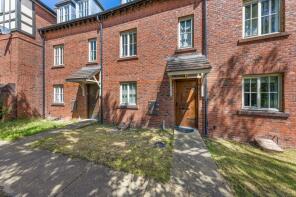
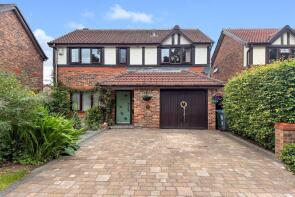
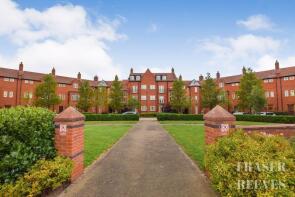
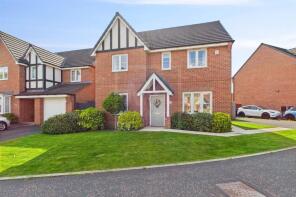
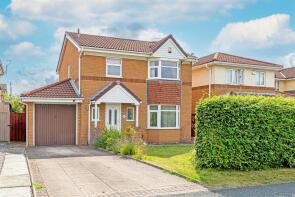
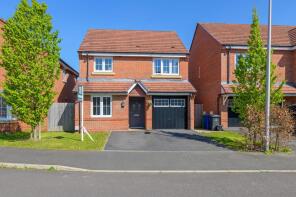
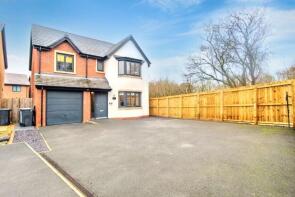
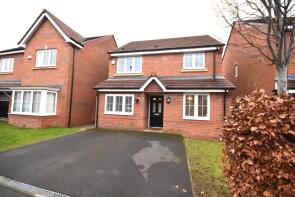
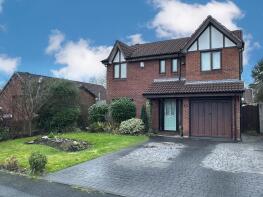
The majority of properties sold in Westbrook during the last year were detached properties, selling for an average price of £390,053. Terraced properties sold for an average of £193,250, with flats fetching £156,000.
Overall, the historical sold prices in Westbrook over the last year were 3% up on the previous year and 9% up on the 2023 peak of £323,060.
Properties Sold
3, Butts Green, Burtonwood And Westbrook, Warrington WA5 7AD
| Today | See what it's worth now |
| 20 Mar 2026 | £360,000 |
| 21 Aug 2015 | £210,995 |
No other historical records.
31, Garwood Close, Westbrook, Warrington WA5 8TQ
| Today | See what it's worth now |
| 6 Mar 2026 | £180,000 |
No other historical records.
60, Falconers Green, Burtonwood And Westbrook, Warrington WA5 7XD
| Today | See what it's worth now |
| 27 Feb 2026 | £575,000 |
| 30 Sep 2011 | £307,500 |
5, Bodkin Green, Burtonwood And Westbrook, Warrington WA5 7AB
| Today | See what it's worth now |
| 13 Feb 2026 | £148,500 |
| 20 Jan 2022 | £128,000 |
14, Archers Green Road, Burtonwood And Westbrook, Warrington WA5 7XS
| Today | See what it's worth now |
| 30 Jan 2026 | £238,000 |
| 24 Jun 2021 | £220,000 |
91, Westbrook Crescent, Old Hall, Warrington WA5 8TE
| Today | See what it's worth now |
| 6 Jan 2026 | £365,000 |
No other historical records.
2, Archers Green Road, Burtonwood And Westbrook, Warrington WA5 7XS

| Today | See what it's worth now |
| 6 Jan 2026 | £305,000 |
| 31 May 2023 | £278,000 |
77, Butts Green, Burtonwood And Westbrook, Warrington WA5 7XT
| Today | See what it's worth now |
| 22 Dec 2025 | £152,000 |
| 13 Nov 2019 | £107,000 |
12, Pegasus Drive, Burtonwood And Westbrook, Warrington WA5 8AS
| Today | See what it's worth now |
| 19 Dec 2025 | £460,000 |
| 9 Dec 2016 | £359,995 |
No other historical records.
9, Garwood Close, Westbrook, Warrington WA5 8TQ
| Today | See what it's worth now |
| 21 Nov 2025 | £325,000 |
No other historical records.
4, Tourney Green, Burtonwood And Westbrook, Warrington WA5 7XN
| Today | See what it's worth now |
| 12 Nov 2025 | £378,000 |
| 18 Sep 1997 | £87,995 |
No other historical records.
20, Garwood Close, Warrington WA5 8TF

| Today | See what it's worth now |
| 10 Nov 2025 | £400,000 |
| 15 Dec 2022 | £395,000 |
118, Castle Green, Burtonwood And Westbrook, Warrington WA5 7XA
| Today | See what it's worth now |
| 30 Oct 2025 | £360,000 |
| 27 Nov 2009 | £175,000 |
10, Barford Close, Great Sankey, Warrington WA5 8TL
| Today | See what it's worth now |
| 17 Oct 2025 | £375,000 |
No other historical records.
28, Butts Green, Burtonwood And Westbrook, Warrington WA5 7XU
| Today | See what it's worth now |
| 16 Oct 2025 | £340,000 |
| 26 Aug 2014 | £218,000 |
26, Partisan Green, Burtonwood And Westbrook, Warrington WA5 7AA
| Today | See what it's worth now |
| 2 Oct 2025 | £445,000 |
| 11 Mar 2016 | £216,500 |
No other historical records.
17, Partisan Green, Burtonwood And Westbrook, Warrington WA5 7AA
| Today | See what it's worth now |
| 1 Oct 2025 | £358,000 |
| 22 May 2015 | £211,995 |
No other historical records.
32, Blackshaw Drive, Great Sankey, Warrington WA5 8XT
| Today | See what it's worth now |
| 1 Oct 2025 | £380,000 |
| 29 Sep 1995 | £100,000 |
No other historical records.
46, Tourney Green, Burtonwood And Westbrook, Warrington WA5 7XN
| Today | See what it's worth now |
| 1 Sep 2025 | £490,000 |
| 23 Nov 1999 | £143,500 |
6, Serenity Gardens, Burtonwood And Westbrook, Warrington WA5 8AX
| Today | See what it's worth now |
| 22 Aug 2025 | £460,000 |
| 28 Mar 2022 | £414,500 |
No other historical records.
9, Partisan Green, Burtonwood And Westbrook, Warrington WA5 7AA
| Today | See what it's worth now |
| 15 Aug 2025 | £340,000 |
| 27 Mar 2015 | £209,995 |
No other historical records.
81, Butts Green, Burtonwood And Westbrook, Warrington WA5 7XT
| Today | See what it's worth now |
| 7 Jul 2025 | £160,000 |
| 1 Jun 2022 | £152,000 |
22, Pendine Close, Burtonwood And Westbrook, Warrington WA5 9RQ
| Today | See what it's worth now |
| 4 Jul 2025 | £415,000 |
| 25 Aug 2017 | £260,000 |
Source Acknowledgement: © Crown copyright. England and Wales house price data is publicly available information produced by the HM Land Registry.This material was last updated on 9 July 2026. It covers the period from 1 January 1995 to 30 April 2026 and contains property transactions which have been registered during that period. Contains HM Land Registry data © Crown copyright and database right 2026. This data is licensed under the Open Government Licence v3.0.
Disclaimer: Rightmove.co.uk provides this HM Land Registry data "as is". The burden for fitness of the data relies completely with the user and is provided for informational purposes only. No warranty, express or implied, is given relating to the accuracy of content of the HM Land Registry data and Rightmove does not accept any liability for error or omission. If you have found an error with the data or need further information please contact HM Land Registry.
Permitted Use: Viewers of this Information are granted permission to access this Crown copyright material and to download it onto electronic, magnetic, optical or similar storage media provided that such activities are for private research, study or in-house use only. Any other use of the material requires the formal written permission of Land Registry which can be requested from us, and is subject to an additional licence and associated charge.
Rightmove takes no liability for your use of, or reliance on, Rightmove's Instant Valuation due to the limitations of our tracking tool listed here. Use of this tool is taken entirely at your own risk. All rights reserved.