
House Prices in Wetherup Street
House prices in Wetherup Street have an overall average of £296,510 over the last year.
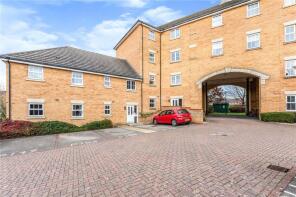
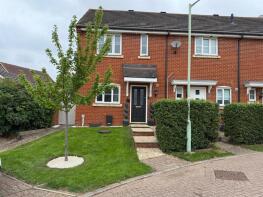
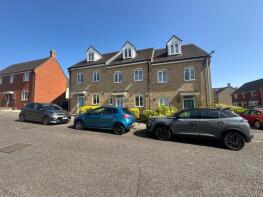
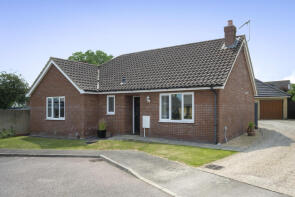
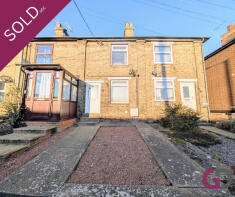
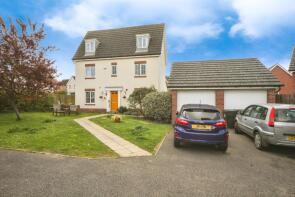
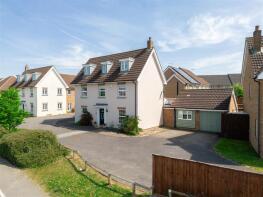
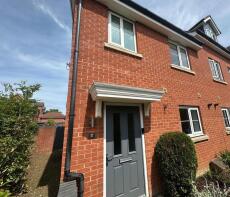
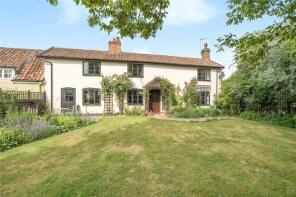
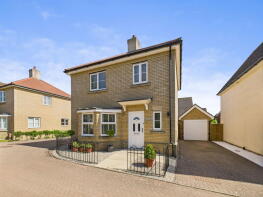
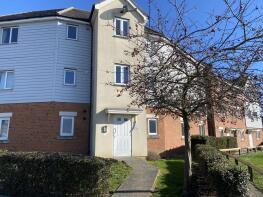
The majority of properties sold in Wetherup Street during the last year were terraced properties, selling for an average price of £231,217. Detached properties sold for an average of £411,554, with semi-detached properties fetching £289,019.
Overall, the historical sold prices in Wetherup Street over the last year were 8% down on the previous year and 7% down on the 2022 peak of £320,348.
Properties Sold
61, Osprey Drive, Stowmarket IP14 5FT
| Today | See what it's worth now |
| 12 Dec 2025 | £255,000 |
| 12 Sep 2014 | £200,000 |
No other historical records.
8, Egret Drive, Stowmarket IP14 5JQ
| Today | See what it's worth now |
| 12 Dec 2025 | £290,000 |
| 30 Jun 2017 | £270,000 |
No other historical records.
12, Cormorant Drive, Stowmarket IP14 5UE
| Today | See what it's worth now |
| 12 Dec 2025 | £247,500 |
| 25 Mar 2022 | £248,000 |
23, Goosander Road, Stowmarket IP14 5BD
| Today | See what it's worth now |
| 28 Nov 2025 | £335,000 |
| 29 May 2018 | £277,000 |
47, Nuthatch Close, Stowmarket IP14 5BF
| Today | See what it's worth now |
| 27 Nov 2025 | £145,000 |
| 24 Jun 2022 | £140,000 |
5, Dunnock Close, Stowmarket IP14 5UA
| Today | See what it's worth now |
| 21 Nov 2025 | £255,000 |
| 27 Mar 2017 | £220,000 |
3, Brambling Close, Stowmarket IP14 5UN
| Today | See what it's worth now |
| 21 Nov 2025 | £240,000 |
| 18 May 2006 | £161,495 |
No other historical records.
3, Suncrest Rise, Stowmarket IP14 5UU
| Today | See what it's worth now |
| 21 Nov 2025 | £395,000 |
| 7 Oct 2009 | £210,000 |
No other historical records.
36, Creeting Road West, Stowmarket IP14 5AU
| Today | See what it's worth now |
| 14 Nov 2025 | £167,000 |
| 30 Jun 2004 | £99,950 |
31, Peregrine Drive, Stowmarket IP14 5GG
| Today | See what it's worth now |
| 14 Nov 2025 | £430,000 |
| 13 Feb 2019 | £400,000 |
No other historical records.
67, Osprey Drive, Stowmarket IP14 5FT


| Today | See what it's worth now |
| 14 Nov 2025 | £278,000 |
| 15 Aug 2014 | £197,500 |
No other historical records.
7, Quail Close, Stowmarket IP14 5FS
| Today | See what it's worth now |
| 14 Nov 2025 | £480,000 |
| 23 Oct 2023 | £480,000 |
Mayfield, Church Lane, Stowmarket IP14 5JL
| Today | See what it's worth now |
| 24 Oct 2025 | £500,000 |
| 25 Jun 1999 | £125,000 |
No other historical records.
8, Redwing Drive, Stowmarket IP14 5FN
| Today | See what it's worth now |
| 24 Oct 2025 | £365,000 |
| 30 Aug 2007 | £236,000 |
1, Pintail Road, Stowmarket IP14 5FP
| Today | See what it's worth now |
| 22 Oct 2025 | £245,000 |
| 16 Feb 2012 | £155,500 |
15, Cardinalls Road, Stowmarket IP14 5AA
| Today | See what it's worth now |
| 22 Oct 2025 | £165,000 |
| 18 Oct 2024 | £125,000 |
No other historical records.
29, Egret Drive, Stowmarket IP14 5JG
| Today | See what it's worth now |
| 21 Oct 2025 | £275,000 |
| 26 Jan 2018 | £270,000 |
No other historical records.
17, Wagtail Drive, Stowmarket IP14 5GH
| Today | See what it's worth now |
| 21 Oct 2025 | £440,000 |
| 15 Sep 2008 | £320,995 |
No other historical records.
26, Cormorant Drive, Stowmarket IP14 5UE
| Today | See what it's worth now |
| 20 Oct 2025 | £308,000 |
| 15 Aug 2018 | £260,000 |
144, Kittiwake Court, Stowmarket IP14 5GS
| Today | See what it's worth now |
| 17 Oct 2025 | £150,000 |
| 20 Aug 2008 | £120,000 |
No other historical records.
5, The Sidings, Stowmarket IP14 5TS
| Today | See what it's worth now |
| 16 Oct 2025 | £275,000 |
| 11 May 2021 | £270,000 |
37, Buzzard Rise, Stowmarket IP14 5JE
| Today | See what it's worth now |
| 14 Oct 2025 | £225,000 |
| 19 Sep 2011 | £136,995 |
No other historical records.
Green Man Place, Mendlesham Green, Stowmarket IP14 5RJ
| Today | See what it's worth now |
| 3 Oct 2025 | £470,000 |
| 6 Apr 2009 | £245,000 |
41, Eider Close, Stowmarket IP14 5UW
| Today | See what it's worth now |
| 3 Oct 2025 | £325,000 |
| 18 Dec 2013 | £196,000 |
No other historical records.
71, Phoenix Way, Stowmarket IP14 5FB
| Today | See what it's worth now |
| 3 Oct 2025 | £147,500 |
| 21 Oct 2017 | £155,000 |
Source Acknowledgement: © Crown copyright. England and Wales house price data is publicly available information produced by the HM Land Registry.This material was last updated on 2 December 2025. It covers the period from 1 January 1995 to 31 October 2025 and contains property transactions which have been registered during that period. Contains HM Land Registry data © Crown copyright and database right 2026. This data is licensed under the Open Government Licence v3.0.
Disclaimer: Rightmove.co.uk provides this HM Land Registry data "as is". The burden for fitness of the data relies completely with the user and is provided for informational purposes only. No warranty, express or implied, is given relating to the accuracy of content of the HM Land Registry data and Rightmove does not accept any liability for error or omission. If you have found an error with the data or need further information please contact HM Land Registry.
Permitted Use: Viewers of this Information are granted permission to access this Crown copyright material and to download it onto electronic, magnetic, optical or similar storage media provided that such activities are for private research, study or in-house use only. Any other use of the material requires the formal written permission of Land Registry which can be requested from us, and is subject to an additional licence and associated charge.
Map data ©OpenStreetMap contributors.
Rightmove takes no liability for your use of, or reliance on, Rightmove's Instant Valuation due to the limitations of our tracking tool listed here. Use of this tool is taken entirely at your own risk. All rights reserved.