
House Prices in Whitby
House prices in Whitby have an overall average of £241,361 over the last year.
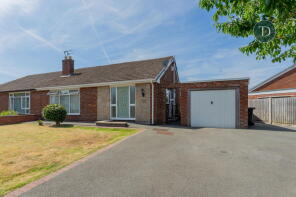
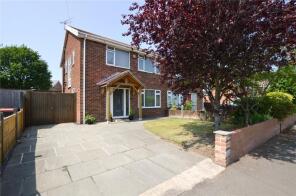
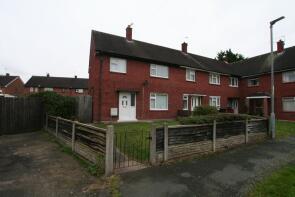
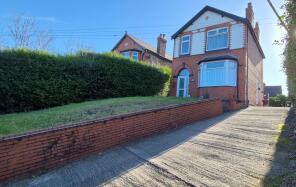
The majority of properties sold in Whitby during the last year were semi-detached properties, selling for an average price of £230,490. Detached properties sold for an average of £331,917, with terraced properties fetching £206,444.
Overall, the historical sold prices in Whitby over the last year were similar to the previous year and 5% up on the 2022 peak of £229,362.
Properties Sold
101, Underwood Drive, Ellesmere Port CH65 6TN
| Today | See what it's worth now |
| 10 Apr 2026 | £250,000 |
| 7 Oct 2021 | £195,000 |
No other historical records.
13, Strawberry Park, Whitby, Ellesmere Port CH66 2YS
| Today | See what it's worth now |
| 1 Apr 2026 | £118,000 |
| 29 Feb 2008 | £149,950 |
No other historical records.
7, Hartford Drive, Whitby, Ellesmere Port CH65 7ER

| Today | See what it's worth now |
| 27 Mar 2026 | £85,705 |
| 20 Dec 2021 | £153,000 |
No other historical records.
37, Bedford Avenue East, Whitby, Ellesmere Port CH65 6TS
| Today | See what it's worth now |
| 27 Mar 2026 | £265,000 |
| 17 Sep 1999 | £80,000 |
No other historical records.
3, Royston Close, Great Sutton, Ellesmere Port CH66 2TT

| Today | See what it's worth now |
| 20 Mar 2026 | £233,000 |
| 13 Apr 2017 | £155,000 |
19, Horstone Crescent, Great Sutton, Ellesmere Port CH66 2JP
| Today | See what it's worth now |
| 5 Mar 2026 | £225,000 |
| 11 Aug 2000 | £59,995 |
21, Mansfield Road, Whitby, Ellesmere Port CH65 6ST
| Today | See what it's worth now |
| 4 Mar 2026 | £220,300 |
| 4 Mar 2020 | £160,000 |
9, Lilac Grove, Whitby, Ellesmere Port CH66 2PH
| Today | See what it's worth now |
| 2 Mar 2026 | £250,000 |
No other historical records.
18, Horstone Road, Great Sutton, Ellesmere Port CH66 2JW
| Today | See what it's worth now |
| 27 Feb 2026 | £237,500 |
No other historical records.
154, Chester Road, Whitby, Ellesmere Port CH65 6SA
| Today | See what it's worth now |
| 27 Feb 2026 | £350,000 |
| 16 Nov 2017 | £147,500 |
No other historical records.
35, Birkett Avenue, Ellesmere Port CH65 9BX
| Today | See what it's worth now |
| 12 Feb 2026 | £195,000 |
No other historical records.
9, Buttermere Avenue, Ellesmere Port CH65 9BN
| Today | See what it's worth now |
| 12 Feb 2026 | £208,500 |
No other historical records.
5, Birch Grove, Whitby, Ellesmere Port CH66 2PX
| Today | See what it's worth now |
| 9 Feb 2026 | £260,000 |
| 5 Aug 2022 | £235,000 |
14, Baytree Close, Great Sutton, Ellesmere Port CH66 2XZ
| Today | See what it's worth now |
| 9 Feb 2026 | £240,000 |
| 3 Sep 2013 | £224,995 |
37, Mansfield Road, Whitby, Ellesmere Port CH65 6ST
| Today | See what it's worth now |
| 3 Feb 2026 | £227,000 |
| 1 Oct 2007 | £139,995 |
No other historical records.
19, Faraday Road, Whitby, Ellesmere Port CH65 7DB
| Today | See what it's worth now |
| 23 Jan 2026 | £180,000 |
| 20 Jan 2022 | £146,000 |
No other historical records.
22, Cholmondeley Road, Great Sutton, Ellesmere Port CH65 7BH
| Today | See what it's worth now |
| 23 Jan 2026 | £205,000 |
No other historical records.
15, Strawberry Green, Whitby, Ellesmere Port CH66 2TX
| Today | See what it's worth now |
| 16 Jan 2026 | £230,000 |
No other historical records.
38, Eddisbury Road, Whitby, Ellesmere Port CH66 2JU
| Today | See what it's worth now |
| 7 Jan 2026 | £180,000 |
No other historical records.
60, Maple Grove, Whitby, Ellesmere Port CH66 2PQ
| Today | See what it's worth now |
| 7 Jan 2026 | £250,000 |
| 31 Aug 1995 | £56,000 |
No other historical records.
6, Birkett Avenue, Ellesmere Port CH65 9BZ
| Today | See what it's worth now |
| 18 Dec 2025 | £270,000 |
| 20 Jan 2017 | £175,000 |
23, Beechcroft Drive, Whitby, Ellesmere Port CH65 6PD
| Today | See what it's worth now |
| 16 Dec 2025 | £275,000 |
| 19 Oct 2018 | £185,000 |
No other historical records.
68, Grappenhall Road, Great Sutton, Ellesmere Port CH65 7AU
| Today | See what it's worth now |
| 12 Dec 2025 | £165,000 |
| 25 Feb 2014 | £100,000 |
No other historical records.

Source Acknowledgement: © Crown copyright. England and Wales house price data is publicly available information produced by the HM Land Registry.This material was last updated on 9 July 2026. It covers the period from 1 January 1995 to 30 April 2026 and contains property transactions which have been registered during that period. Contains HM Land Registry data © Crown copyright and database right 2026. This data is licensed under the Open Government Licence v3.0.
Disclaimer: Rightmove.co.uk provides this HM Land Registry data "as is". The burden for fitness of the data relies completely with the user and is provided for informational purposes only. No warranty, express or implied, is given relating to the accuracy of content of the HM Land Registry data and Rightmove does not accept any liability for error or omission. If you have found an error with the data or need further information please contact HM Land Registry.
Permitted Use: Viewers of this Information are granted permission to access this Crown copyright material and to download it onto electronic, magnetic, optical or similar storage media provided that such activities are for private research, study or in-house use only. Any other use of the material requires the formal written permission of Land Registry which can be requested from us, and is subject to an additional licence and associated charge.
Rightmove takes no liability for your use of, or reliance on, Rightmove's Instant Valuation due to the limitations of our tracking tool listed here. Use of this tool is taken entirely at your own risk. All rights reserved.