
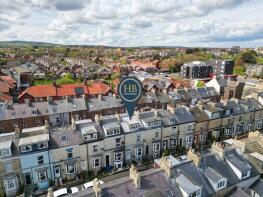
House Prices in Whitby
House prices in Whitby have an overall average of £250,072 over the last year.
The majority of properties sold in Whitby during the last year were semi-detached properties, selling for an average price of £229,297. Terraced properties sold for an average of £245,068, with detached properties fetching £355,820.
Overall, the historical sold prices in Whitby over the last year were 8% down on the previous year and 6% down on the 2022 peak of £266,913.
Properties Sold
2a, Poplar Row, Whitby YO21 3AF
| Today | See what it's worth now |
| 24 Apr 2026 | £250,000 |
| 3 Jun 2003 | £115,500 |
No other historical records.
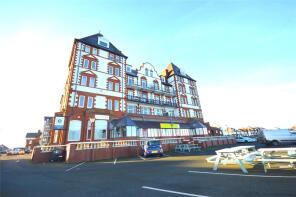
33, Metropole Towers, Argyle Road, Whitby YO21 3HU
| Today | See what it's worth now |
| 14 Apr 2026 | £195,000 |
| 3 Aug 2020 | £255,000 |
12, Stakesby Road, Whitby YO21 1HS
| Today | See what it's worth now |
| 10 Apr 2026 | £285,000 |
| 21 Dec 2021 | £305,000 |
No other historical records.
14, Runswick Court, Whitby YO21 1YF
| Today | See what it's worth now |
| 1 Apr 2026 | £160,000 |
| 5 Mar 2021 | £165,000 |
8, Mount Square, Whitby YO21 3HL
| Today | See what it's worth now |
| 31 Mar 2026 | £152,000 |
| 3 Jun 2003 | £66,250 |
No other historical records.
40, Eskdale Road, Whitby YO22 4JJ
| Today | See what it's worth now |
| 31 Mar 2026 | £250,000 |
| 26 Jan 2018 | £186,000 |
8, Studley Terrace, Whitby YO22 4EL
| Today | See what it's worth now |
| 31 Mar 2026 | £183,800 |
| 14 Jul 2020 | £156,000 |
8, Meadowfields, Whitby YO21 1QF
| Today | See what it's worth now |
| 27 Mar 2026 | £265,000 |
| 14 Dec 2011 | £235,000 |
No other historical records.
31, George Street, Whitby YO21 1EW
| Today | See what it's worth now |
| 26 Mar 2026 | £213,000 |
| 25 Apr 2019 | £165,000 |
2, Stainsacre Lane, Whitby YO22 4HU
| Today | See what it's worth now |
| 26 Mar 2026 | £170,000 |
| 28 Jan 2011 | £117,000 |
15, Lockton Road, Whitby YO21 3NB
| Today | See what it's worth now |
| 23 Mar 2026 | £225,000 |
| 29 Nov 2019 | £159,000 |
49, Queens Drive, Whitby YO22 4HN
| Today | See what it's worth now |
| 23 Mar 2026 | £185,000 |
| 13 Jun 2022 | £180,500 |
Flat 5, Clarence House Flats, Wellington Road, Whitby YO21 1DY
| Today | See what it's worth now |
| 18 Mar 2026 | £55,000 |
| 26 Nov 2014 | £49,000 |
No other historical records.
30, Kingfisher Drive, Whitby YO22 4DY
| Today | See what it's worth now |
| 16 Mar 2026 | £175,000 |
| 22 Jan 2021 | £150,000 |
14, Abrahams Quay, Whitby YO22 4EW
| Today | See what it's worth now |
| 10 Mar 2026 | £299,950 |
| 24 Sep 1998 | £68,950 |
No other historical records.
51, Love Lane, Whitby YO21 3LQ

| Today | See what it's worth now |
| 4 Mar 2026 | £410,000 |
| 25 Aug 2023 | £402,000 |
47, Highfield Road, Whitby YO21 3LW
| Today | See what it's worth now |
| 4 Mar 2026 | £263,000 |
| 28 Feb 2019 | £215,000 |
No other historical records.
21, Sea View Close, Whitby YO21 3NR
| Today | See what it's worth now |
| 25 Feb 2026 | £330,000 |
| 15 Sep 2022 | £330,000 |
117a, Upgang Lane, Whitby YO21 3JW
| Today | See what it's worth now |
| 25 Feb 2026 | £370,000 |
| 15 Oct 1999 | £89,000 |
No other historical records.
10, Hanover Terrace, Whitby YO21 1QQ
| Today | See what it's worth now |
| 13 Feb 2026 | £455,000 |
| 15 Jan 2002 | £135,000 |
No other historical records.
Flat 3, Havelock Place, Belle Vue Terrace, Whitby YO21 3ER
| Today | See what it's worth now |
| 12 Feb 2026 | £155,000 |
| 28 Nov 2002 | £44,250 |
5, Clarkson Street, Whitby YO21 3BZ
| Today | See what it's worth now |
| 11 Feb 2026 | £113,000 |
| 28 Jun 2019 | £159,000 |
22, Meadowfields, Whitby YO21 1QF
| Today | See what it's worth now |
| 9 Feb 2026 | £220,000 |
| 17 Jun 2011 | £166,000 |
Source Acknowledgement: © Crown copyright. England and Wales house price data is publicly available information produced by the HM Land Registry.This material was last updated on 9 July 2026. It covers the period from 1 January 1995 to 30 April 2026 and contains property transactions which have been registered during that period. Contains HM Land Registry data © Crown copyright and database right 2026. This data is licensed under the Open Government Licence v3.0.
Disclaimer: Rightmove.co.uk provides this HM Land Registry data "as is". The burden for fitness of the data relies completely with the user and is provided for informational purposes only. No warranty, express or implied, is given relating to the accuracy of content of the HM Land Registry data and Rightmove does not accept any liability for error or omission. If you have found an error with the data or need further information please contact HM Land Registry.
Permitted Use: Viewers of this Information are granted permission to access this Crown copyright material and to download it onto electronic, magnetic, optical or similar storage media provided that such activities are for private research, study or in-house use only. Any other use of the material requires the formal written permission of Land Registry which can be requested from us, and is subject to an additional licence and associated charge.
Rightmove takes no liability for your use of, or reliance on, Rightmove's Instant Valuation due to the limitations of our tracking tool listed here. Use of this tool is taken entirely at your own risk. All rights reserved.