
House Prices in Whitwell
House prices in Whitwell have an overall average of £167,096 over the last year.
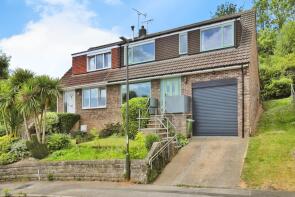
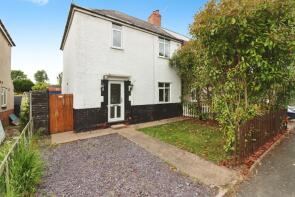
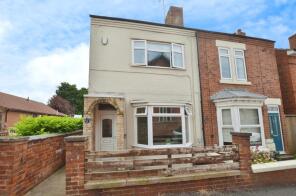
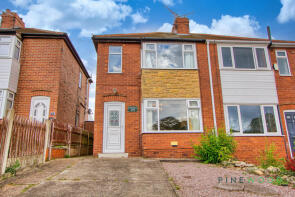
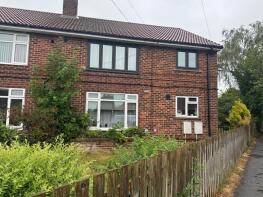
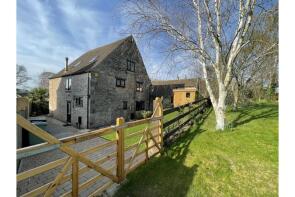
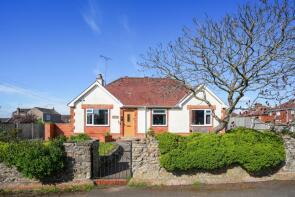
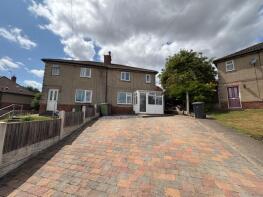
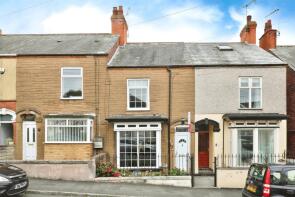
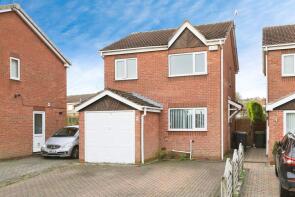
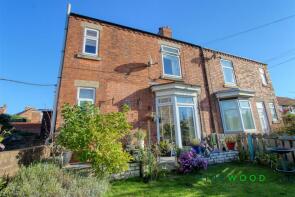
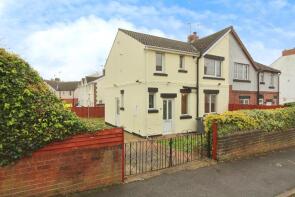
The majority of properties sold in Whitwell during the last year were semi-detached properties, selling for an average price of £147,875. Detached properties sold for an average of £259,450, with terraced properties fetching £102,400.
Overall, the historical sold prices in Whitwell over the last year were 9% down on the previous year and 6% down on the 2022 peak of £177,260.
Properties Sold
6, Hennymoor Close, Worksop S80 4NB
| Today | See what it's worth now |
| 27 Feb 2026 | £259,700 |
| 12 Jan 2023 | £258,000 |
13, Longhurst View, Worksop S80 4QW
| Today | See what it's worth now |
| 13 Feb 2026 | £175,000 |
| 5 Apr 2024 | £135,000 |
2, Coronation Street, Worksop S80 4TG
| Today | See what it's worth now |
| 16 Jan 2026 | £110,000 |
| 17 Sep 2021 | £95,000 |
14a, Welbeck Street, Worksop S80 4TW
| Today | See what it's worth now |
| 16 Jan 2026 | £80,000 |
| 12 Aug 2004 | £64,750 |
47, Holmefield Road, Worksop S80 4UB
| Today | See what it's worth now |
| 13 Jan 2026 | £132,000 |
| 26 Feb 2019 | £90,000 |
No other historical records.
64, Bakestone Moor, Worksop S80 4QD

| Today | See what it's worth now |
| 16 Dec 2025 | £65,000 |
| 1 Jul 2022 | £165,000 |
14, Bellsfield Close, Worksop S80 4TA
| Today | See what it's worth now |
| 28 Nov 2025 | £185,000 |
| 16 May 2023 | £170,000 |
3, Longhurst View, Worksop S80 4QW
| Today | See what it's worth now |
| 27 Nov 2025 | £243,000 |
| 13 Dec 2021 | £217,500 |
13, Jubilee Road, Worksop S80 4PL
| Today | See what it's worth now |
| 24 Nov 2025 | £138,000 |
| 19 Nov 2004 | £70,200 |
No other historical records.
17, Fox Road, Worksop S80 4SA
| Today | See what it's worth now |
| 24 Nov 2025 | £140,000 |
| 14 Sep 2020 | £107,500 |
39, Franklin Crescent, Worksop S80 4PT

| Today | See what it's worth now |
| 14 Nov 2025 | £225,000 |
| 22 Jul 2011 | £115,000 |
24, Hillside, Whitwell S80 4PH
| Today | See what it's worth now |
| 10 Nov 2025 | £142,500 |
No other historical records.
57, Station Road, Worksop S80 4TS
| Today | See what it's worth now |
| 28 Oct 2025 | £158,000 |
| 1 Feb 2016 | £85,000 |
No other historical records.
29, Station Road, Worksop S80 4UF

| Today | See what it's worth now |
| 17 Oct 2025 | £77,000 |
| 25 Jan 2019 | £53,000 |
42a, Holmefield Road, Worksop S80 4TX
| Today | See what it's worth now |
| 17 Oct 2025 | £87,000 |
| 1 Sep 2022 | £82,500 |
21, Southfield Lane, Worksop S80 4NS

| Today | See what it's worth now |
| 19 Sep 2025 | £117,000 |
| 8 Dec 2006 | £90,000 |
The Bakery, Old Hall Lane, Worksop S80 4QX
| Today | See what it's worth now |
| 19 Sep 2025 | £535,000 |
| 29 Jun 2021 | £440,000 |
Jomihvar, Sandy Lane, Worksop S80 4QA
| Today | See what it's worth now |
| 12 Sep 2025 | £250,000 |
| 30 Jul 2021 | £187,000 |
No other historical records.
15, Southfield Close, Worksop S80 4PA
| Today | See what it's worth now |
| 5 Sep 2025 | £165,000 |
| 14 Sep 2007 | £89,500 |
23, Duke Street, Worksop S80 4TH
| Today | See what it's worth now |
| 2 Sep 2025 | £97,000 |
| 28 May 1997 | £28,950 |
No other historical records.
9, Belfmoor Close, Worksop S80 4NZ
| Today | See what it's worth now |
| 29 Aug 2025 | £169,000 |
| 30 May 2003 | £89,000 |
15, Spring Hill, Worksop S80 4RZ
| Today | See what it's worth now |
| 29 Aug 2025 | £160,000 |
| 21 Jul 2006 | £82,500 |
No other historical records.
8, Duchess Street, Worksop S80 4TL
| Today | See what it's worth now |
| 11 Aug 2025 | £133,000 |
| 10 Jun 2022 | £68,000 |
No other historical records.

Source Acknowledgement: © Crown copyright. England and Wales house price data is publicly available information produced by the HM Land Registry.This material was last updated on 9 July 2026. It covers the period from 1 January 1995 to 30 April 2026 and contains property transactions which have been registered during that period. Contains HM Land Registry data © Crown copyright and database right 2026. This data is licensed under the Open Government Licence v3.0.
Disclaimer: Rightmove.co.uk provides this HM Land Registry data "as is". The burden for fitness of the data relies completely with the user and is provided for informational purposes only. No warranty, express or implied, is given relating to the accuracy of content of the HM Land Registry data and Rightmove does not accept any liability for error or omission. If you have found an error with the data or need further information please contact HM Land Registry.
Permitted Use: Viewers of this Information are granted permission to access this Crown copyright material and to download it onto electronic, magnetic, optical or similar storage media provided that such activities are for private research, study or in-house use only. Any other use of the material requires the formal written permission of Land Registry which can be requested from us, and is subject to an additional licence and associated charge.
Rightmove takes no liability for your use of, or reliance on, Rightmove's Instant Valuation due to the limitations of our tracking tool listed here. Use of this tool is taken entirely at your own risk. All rights reserved.