
House Prices in Whitworth
House prices in Whitworth have an overall average of £183,538 over the last year.
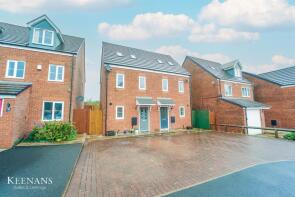
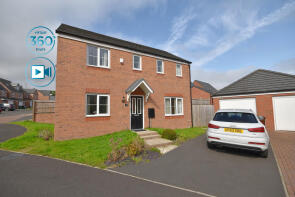
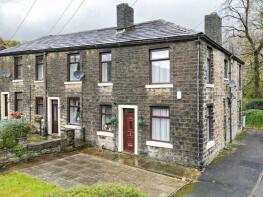
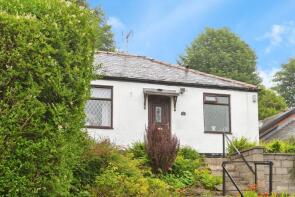
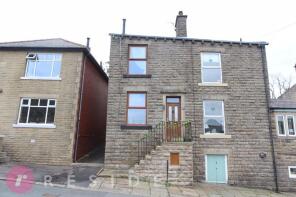
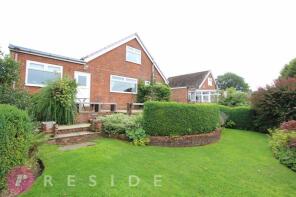
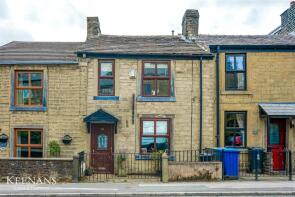
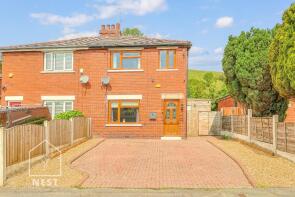
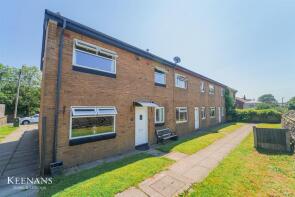
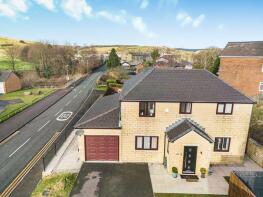
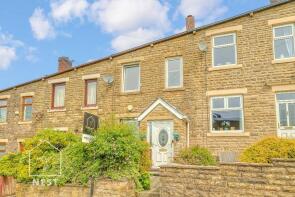
The majority of properties sold in Whitworth during the last year were terraced properties, selling for an average price of £156,701. Semi-detached properties sold for an average of £210,844, with detached properties fetching £316,571.
Overall, the historical sold prices in Whitworth over the last year were 12% down on the previous year and 9% down on the 2023 peak of £200,909.
Properties Sold
8, Thor Drive, Whitworth, Rochdale OL12 8EU
| Today | See what it's worth now |
| 13 Apr 2026 | £180,000 |
| 1 Jul 2014 | £129,995 |
No other historical records.
4, Spinners Drive, Whitworth, Rochdale OL12 8ES
| Today | See what it's worth now |
| 1 Apr 2026 | £300,000 |
| 26 Mar 2021 | £208,000 |
56, Elm Street, Whitworth, Rochdale OL12 8DH
| Today | See what it's worth now |
| 27 Mar 2026 | £129,500 |
| 4 Jul 2022 | £118,000 |
113, Tonacliffe Road, Whitworth, Rochdale OL12 8SJ
| Today | See what it's worth now |
| 27 Mar 2026 | £150,000 |
| 28 Jun 2004 | £124,950 |
No other historical records.
3, Spring Bank, Acre Street, Whitworth, Rochdale OL12 8QU
| Today | See what it's worth now |
| 24 Mar 2026 | £157,000 |
| 22 Jun 2007 | £124,950 |
13, Alfred Street, Whitworth, Rochdale OL12 8JP
| Today | See what it's worth now |
| 23 Mar 2026 | £135,000 |
| 29 Apr 2022 | £111,500 |
50, Longacres Drive, Whitworth, Rochdale OL12 8QX
| Today | See what it's worth now |
| 23 Mar 2026 | £275,000 |
| 13 Feb 2004 | £180,000 |
No other historical records.
10, Thorneylea, Whitworth, Rochdale OL12 8QY

| Today | See what it's worth now |
| 20 Mar 2026 | £60,000 |
| 17 Oct 2012 | £44,950 |
21, Orama Avenue, Whitworth, Rochdale OL12 8ED

| Today | See what it's worth now |
| 20 Mar 2026 | £180,000 |
| 18 Dec 2015 | £119,995 |
No other historical records.
1, The Beeches, New Way, Whitworth, Rochdale OL12 8AP

| Today | See what it's worth now |
| 12 Mar 2026 | £310,000 |
| 22 Apr 2016 | £118,500 |
No other historical records.
2, Freeholds Terrace, Shawforth, Rochdale OL12 8HL
| Today | See what it's worth now |
| 6 Mar 2026 | £85,000 |
| 5 Jun 2020 | £53,500 |
8, Taylor Street, Whitworth, Rochdale OL12 8PT

| Today | See what it's worth now |
| 5 Mar 2026 | £203,000 |
| 16 Oct 2017 | £98,500 |
No other historical records.
4, Station Road, Facit, Rochdale OL12 8LJ

| Today | See what it's worth now |
| 27 Feb 2026 | £180,000 |
| 10 Apr 2014 | £80,000 |
No other historical records.
131, Market Street, Whitworth, Rochdale OL12 8SE
| Today | See what it's worth now |
| 27 Feb 2026 | £164,000 |
| 2 Nov 2001 | £48,500 |
16, Holt Street, Whitworth, Rochdale OL12 8AE
| Today | See what it's worth now |
| 27 Feb 2026 | £170,000 |
No other historical records.
50, Market Street, Whitworth, Rochdale OL12 8RW

| Today | See what it's worth now |
| 13 Feb 2026 | £144,500 |
| 24 Aug 2021 | £116,000 |
448, Market Street, Whitworth, Rochdale OL12 8QN
| Today | See what it's worth now |
| 30 Jan 2026 | £130,000 |
| 25 Jan 2013 | £89,500 |
8, Kandel Place, Whitworth, Rochdale OL12 8RF
| Today | See what it's worth now |
| 30 Jan 2026 | £180,000 |
| 9 Jul 2021 | £147,000 |
6, Holt Street, Whitworth, Rochdale OL12 8AE
| Today | See what it's worth now |
| 30 Jan 2026 | £207,000 |
| 12 May 2006 | £136,000 |
462, Market Street, Whitworth, Rochdale OL12 8QN
| Today | See what it's worth now |
| 19 Jan 2026 | £117,000 |
| 20 Mar 2008 | £80,000 |
No other historical records.
59, John Street, Whitworth, Rochdale OL12 8BT
| Today | See what it's worth now |
| 19 Dec 2025 | £206,000 |
| 29 Jul 1996 | £35,750 |
No other historical records.
71, Tonacliffe Road, Whitworth, Rochdale OL12 8SJ

| Today | See what it's worth now |
| 16 Dec 2025 | £220,000 |
No other historical records.
33, Rawstron Street, Whitworth, Rochdale OL12 8BA
| Today | See what it's worth now |
| 12 Dec 2025 | £164,950 |
| 23 May 2008 | £108,000 |
No other historical records.
Source Acknowledgement: © Crown copyright. England and Wales house price data is publicly available information produced by the HM Land Registry.This material was last updated on 9 July 2026. It covers the period from 1 January 1995 to 30 April 2026 and contains property transactions which have been registered during that period. Contains HM Land Registry data © Crown copyright and database right 2026. This data is licensed under the Open Government Licence v3.0.
Disclaimer: Rightmove.co.uk provides this HM Land Registry data "as is". The burden for fitness of the data relies completely with the user and is provided for informational purposes only. No warranty, express or implied, is given relating to the accuracy of content of the HM Land Registry data and Rightmove does not accept any liability for error or omission. If you have found an error with the data or need further information please contact HM Land Registry.
Permitted Use: Viewers of this Information are granted permission to access this Crown copyright material and to download it onto electronic, magnetic, optical or similar storage media provided that such activities are for private research, study or in-house use only. Any other use of the material requires the formal written permission of Land Registry which can be requested from us, and is subject to an additional licence and associated charge.
Rightmove takes no liability for your use of, or reliance on, Rightmove's Instant Valuation due to the limitations of our tracking tool listed here. Use of this tool is taken entirely at your own risk. All rights reserved.