
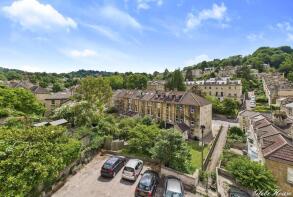
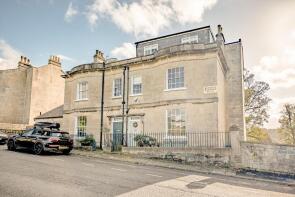
House Prices in Widcombe
House prices in Widcombe have an overall average of £629,714 over the last year.
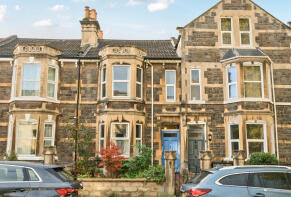
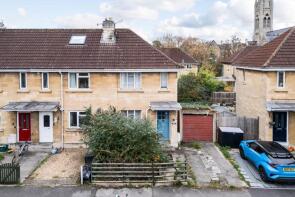
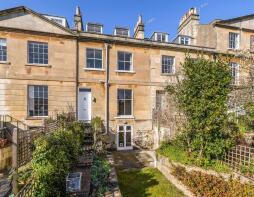
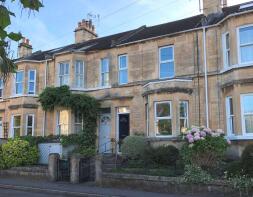
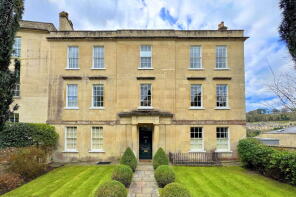
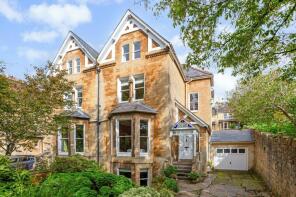
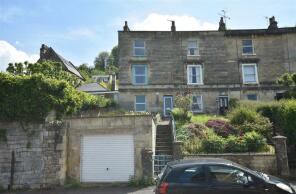
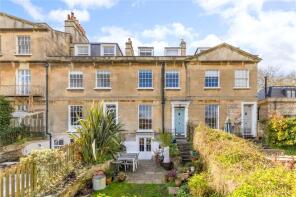
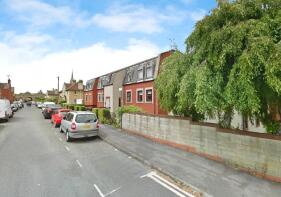
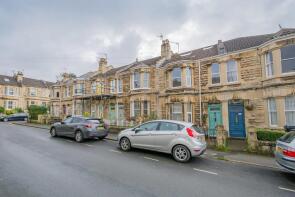
The majority of properties sold in Widcombe during the last year were terraced properties, selling for an average price of £591,571. Flats sold for an average of £538,750, with semi-detached properties fetching £722,500.
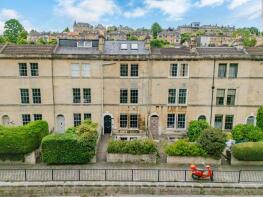
Overall, the historical sold prices in Widcombe over the last year were 35% down on the previous year and 29% down on the 2022 peak of £886,940.
Properties Sold
Flat 6, Glebe House, Widcombe Hill, Widcombe, Bath BA2 6AA
| Today | See what it's worth now |
| 31 Mar 2026 | £320,000 |
No other historical records.
26, Pulteney Gardens, Widcombe, Bath BA2 4HG
| Today | See what it's worth now |
| 6 Mar 2026 | £363,000 |
No other historical records.
14, Spring Crescent, Widcombe, Bath BA2 4HZ
| Today | See what it's worth now |
| 13 Feb 2026 | £276,000 |
No other historical records.
8, Caroline Buildings, Widcombe, Bath BA2 4JH
| Today | See what it's worth now |
| 11 Feb 2026 | £900,000 |
| 18 Feb 2021 | £850,000 |
42, Lyncombe Hill, Lyncombe, Bath BA2 4PH
| Today | See what it's worth now |
| 11 Feb 2026 | £1,075,000 |
| 13 Aug 1996 | £192,000 |
No other historical records.
Garden Maisonette, 11, Widcombe Crescent, Widcombe, Bath BA2 6AH
| Today | See what it's worth now |
| 21 Jan 2026 | £725,000 |
| 20 Oct 1997 | £126,500 |
No other historical records.
25, Alexandra Road, Lyncombe, Bath BA2 4PW

| Today | See what it's worth now |
| 12 Dec 2025 | £595,000 |
| 30 Sep 2021 | £475,000 |
4, Pulteney Grove, Widcombe, Bath BA2 4HQ
| Today | See what it's worth now |
| 28 Nov 2025 | £700,000 |
| 23 Nov 2018 | £550,000 |
Flat 1, Somerset House, Church Street, Widcombe, Bath BA2 6AZ
| Today | See what it's worth now |
| 21 Nov 2025 | £840,000 |
No other historical records.
8, St Matthew's Place, Pulteney Road, Bathwick, Bath BA2 4JJ
| Today | See what it's worth now |
| 14 Nov 2025 | £650,000 |
| 31 Jul 2017 | £423,500 |
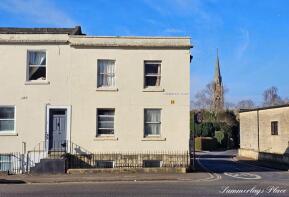
Garden Flat, 12, Summerlays Place, Widcombe, Bath BA2 4HN
| Today | See what it's worth now |
| 7 Nov 2025 | £270,000 |
| 2 Oct 2023 | £245,000 |
No other historical records.
24, Horseshoe Walk, Widcombe, Bath BA2 6DF
| Today | See what it's worth now |
| 14 Oct 2025 | £850,000 |
No other historical records.
16, Prior Park Road, Widcombe, Bath BA2 4NG
| Today | See what it's worth now |
| 29 Aug 2025 | £425,000 |
| 10 Nov 2021 | £400,000 |
9, Prior Park Cottages, Widcombe, Bath BA2 4NR
| Today | See what it's worth now |
| 5 Aug 2025 | £827,000 |
| 12 Oct 2016 | £765,000 |
39, Prior Park Road, Widcombe, Bath BA2 4NG
| Today | See what it's worth now |
| 25 Jul 2025 | £1,140,000 |
| 14 Feb 1997 | £82,000 |
No other historical records.
1, St Mark's Road, Widcombe, Bath BA2 4PA
| Today | See what it's worth now |
| 11 Jul 2025 | £615,000 |
No other historical records.
34, Lyncombe Hill, Lyncombe, Bath BA2 4PH
| Today | See what it's worth now |
| 9 Jul 2025 | £1,500,000 |
| 12 Nov 2020 | £1,203,000 |
18, Summerlays Court, Widcombe, Bath BA2 4HU
| Today | See what it's worth now |
| 19 Jun 2025 | £125,000 |
| 28 Jun 2013 | £90,000 |
No other historical records.
1, Macaulay Buildings, Widcombe, Bath BA2 6AS
| Today | See what it's worth now |
| 22 May 2025 | £1,850,000 |
| 9 Dec 2019 | £1,500,000 |
No other historical records.
11, Pulteney Avenue, Widcombe, Bath BA2 4HH
| Today | See what it's worth now |
| 22 Apr 2025 | £450,000 |
No other historical records.
42, Alexandra Road, Lyncombe, Bath BA2 4PW
| Today | See what it's worth now |
| 27 Mar 2025 | £465,000 |
| 29 Jun 2011 | £175,000 |
10, Southcot Place, Lyncombe, Bath BA2 4PE
| Today | See what it's worth now |
| 21 Mar 2025 | £425,000 |
| 16 Jul 2004 | £265,000 |
11, Pulteney Terrace, Pulteney Road, Bathwick, Bath BA2 4HJ
| Today | See what it's worth now |
| 21 Mar 2025 | £540,000 |
| 21 Nov 2005 | £293,000 |

Source Acknowledgement: © Crown copyright. England and Wales house price data is publicly available information produced by the HM Land Registry.This material was last updated on 9 July 2026. It covers the period from 1 January 1995 to 30 April 2026 and contains property transactions which have been registered during that period. Contains HM Land Registry data © Crown copyright and database right 2026. This data is licensed under the Open Government Licence v3.0.
Disclaimer: Rightmove.co.uk provides this HM Land Registry data "as is". The burden for fitness of the data relies completely with the user and is provided for informational purposes only. No warranty, express or implied, is given relating to the accuracy of content of the HM Land Registry data and Rightmove does not accept any liability for error or omission. If you have found an error with the data or need further information please contact HM Land Registry.
Permitted Use: Viewers of this Information are granted permission to access this Crown copyright material and to download it onto electronic, magnetic, optical or similar storage media provided that such activities are for private research, study or in-house use only. Any other use of the material requires the formal written permission of Land Registry which can be requested from us, and is subject to an additional licence and associated charge.
Rightmove takes no liability for your use of, or reliance on, Rightmove's Instant Valuation due to the limitations of our tracking tool listed here. Use of this tool is taken entirely at your own risk. All rights reserved.