
House Prices in Wilberfoss
House prices in Wilberfoss have an overall average of £287,857 over the last year.
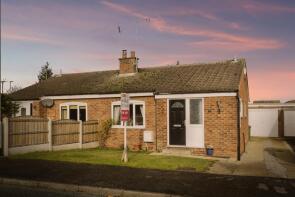
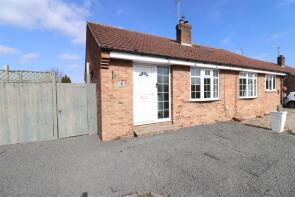
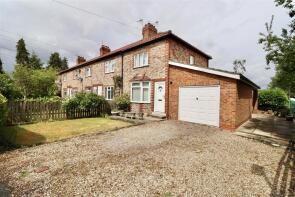
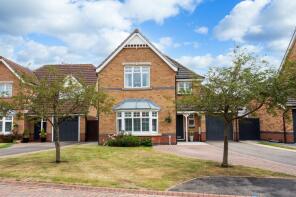
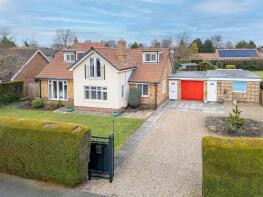
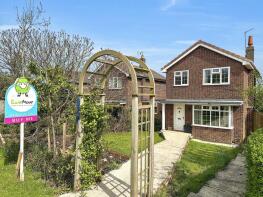
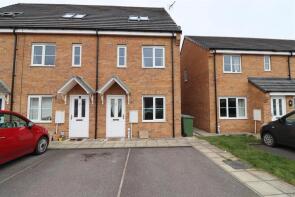
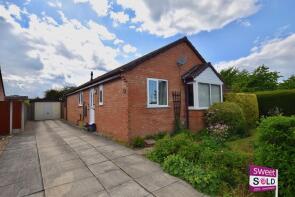
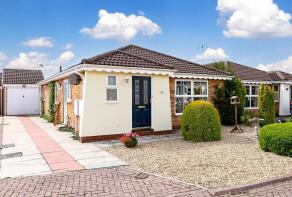
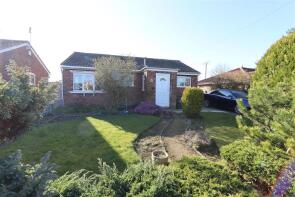
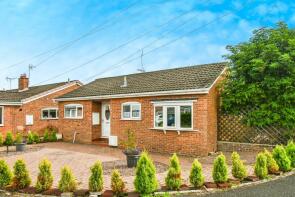
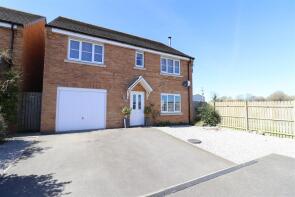
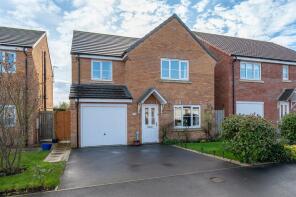
The majority of properties sold in Wilberfoss during the last year were detached properties, selling for an average price of £332,125. Semi-detached properties sold for an average of £225,750, with terraced properties fetching £235,000.
Overall, the historical sold prices in Wilberfoss over the last year were 12% down on the previous year and 18% down on the 2023 peak of £352,465.
Properties Sold
3, Moorfield Drive, York YO41 5PZ
| Today | See what it's worth now |
| 7 Apr 2026 | £210,000 |
| 21 Jul 2016 | £175,000 |
1, St Oswalds Close, York YO41 5LT
| Today | See what it's worth now |
| 1 Apr 2026 | £218,000 |
| 5 Nov 2021 | £190,000 |
Mill Farm, Mill Lane, Wilberfoss YO41 5NJ
| Today | See what it's worth now |
| 3 Mar 2026 | £314,000 |
No other historical records.
4, Cornfield View, York YO41 5AE
| Today | See what it's worth now |
| 21 Jan 2026 | £340,000 |
| 26 Apr 2019 | £265,000 |
Vandi, Storking Lane, Wilberfoss YO41 5ND
| Today | See what it's worth now |
| 11 Dec 2025 | £253,000 |
No other historical records.
38, Main Street, York YO41 5PJ
| Today | See what it's worth now |
| 28 Nov 2025 | £275,000 |
No other historical records.
10, Orchard Close, York YO41 5RW
| Today | See what it's worth now |
| 7 Nov 2025 | £410,000 |
| 18 Oct 2017 | £300,000 |
1, Willow Park Road, York YO41 5PS
| Today | See what it's worth now |
| 23 Oct 2025 | £480,000 |
| 17 Jun 1996 | £92,500 |
No other historical records.
5, Moorfield Drive, York YO41 5PZ
| Today | See what it's worth now |
| 17 Oct 2025 | £200,000 |
| 21 May 2004 | £117,000 |
No other historical records.
77, Main Street, York YO41 5LY
| Today | See what it's worth now |
| 10 Oct 2025 | £285,000 |
| 22 Aug 2007 | £179,000 |
42, Windmill Meadows, York YO41 5RQ
| Today | See what it's worth now |
| 22 Sep 2025 | £217,000 |
| 30 Nov 2017 | £189,999 |
No other historical records.
31, Field Head, York YO41 5RD
| Today | See what it's worth now |
| 29 Aug 2025 | £298,000 |
| 8 Jul 1999 | £92,000 |
50, Moorfield Way, York YO41 5PL
| Today | See what it's worth now |
| 22 Aug 2025 | £310,000 |
| 31 Aug 2012 | £199,950 |
49, Moorfield Way, York YO41 5PN
| Today | See what it's worth now |
| 21 Aug 2025 | £220,000 |
| 7 Feb 2012 | £160,000 |
No other historical records.
22, Moorfield Drive, York YO41 5PZ
| Today | See what it's worth now |
| 30 Jun 2025 | £223,000 |
| 14 Jan 2022 | £206,000 |
No other historical records.
Mill View, Storking Lane, Wilberfoss YO41 5QA
| Today | See what it's worth now |
| 27 Jun 2025 | £320,000 |
No other historical records.
2, Cornfield View, York YO41 5AE
| Today | See what it's worth now |
| 27 Jun 2025 | £365,000 |
| 7 Jul 2017 | £294,999 |
No other historical records.
14, Windmill Meadows, York YO41 5RQ
| Today | See what it's worth now |
| 24 Jun 2025 | £345,000 |
| 24 Mar 2017 | £254,999 |
No other historical records.
38, Willow Park Road, York YO41 5PS
| Today | See what it's worth now |
| 6 Jun 2025 | £380,000 |
| 16 Nov 2015 | £307,500 |
6, Pear Tree Close, York YO41 5RN
| Today | See what it's worth now |
| 28 Apr 2025 | £300,000 |
| 19 Dec 1997 | £97,111 |
No other historical records.
5, Cricketers Way, Wilberfoss YO41 5LU

| Today | See what it's worth now |
| 24 Apr 2025 | £387,500 |
No other historical records.
21, Storking Lane, Wilberfoss YO41 5ND

| Today | See what it's worth now |
| 9 Apr 2025 | £550,000 |
No other historical records.
4, Windmill Meadows, York YO41 5RQ
| Today | See what it's worth now |
| 9 Apr 2025 | £235,000 |
| 15 Nov 2023 | £230,000 |
Source Acknowledgement: © Crown copyright. England and Wales house price data is publicly available information produced by the HM Land Registry.This material was last updated on 9 July 2026. It covers the period from 1 January 1995 to 30 April 2026 and contains property transactions which have been registered during that period. Contains HM Land Registry data © Crown copyright and database right 2026. This data is licensed under the Open Government Licence v3.0.
Disclaimer: Rightmove.co.uk provides this HM Land Registry data "as is". The burden for fitness of the data relies completely with the user and is provided for informational purposes only. No warranty, express or implied, is given relating to the accuracy of content of the HM Land Registry data and Rightmove does not accept any liability for error or omission. If you have found an error with the data or need further information please contact HM Land Registry.
Permitted Use: Viewers of this Information are granted permission to access this Crown copyright material and to download it onto electronic, magnetic, optical or similar storage media provided that such activities are for private research, study or in-house use only. Any other use of the material requires the formal written permission of Land Registry which can be requested from us, and is subject to an additional licence and associated charge.
Rightmove takes no liability for your use of, or reliance on, Rightmove's Instant Valuation due to the limitations of our tracking tool listed here. Use of this tool is taken entirely at your own risk. All rights reserved.