
House Prices in Wimblebury
House prices in Wimblebury have an overall average of £278,967 over the last year.
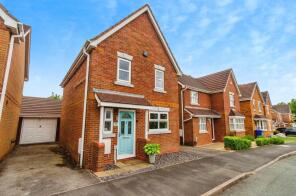
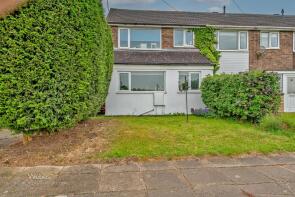
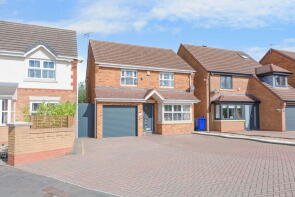
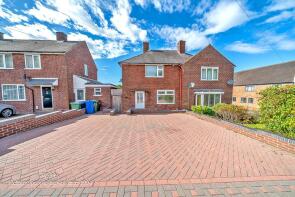
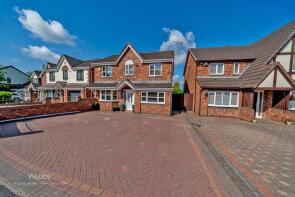
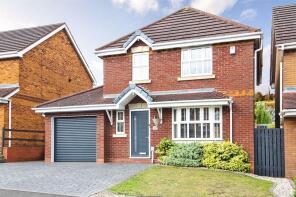
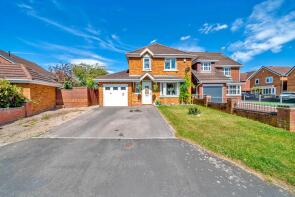
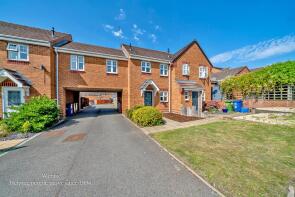
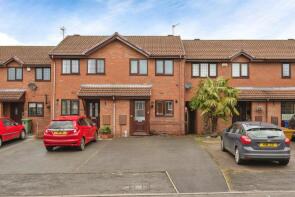
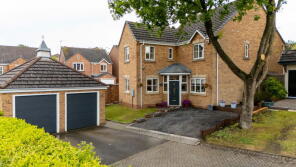
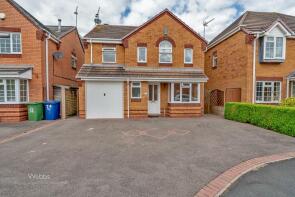
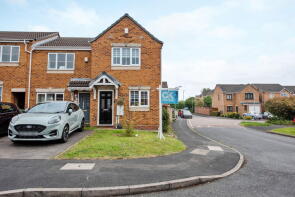
The majority of properties sold in Wimblebury during the last year were detached properties, selling for an average price of £363,292. Semi-detached properties sold for an average of £196,750, with terraced properties fetching £181,500.
Overall, the historical sold prices in Wimblebury over the last year were 12% up on the previous year and 4% up on the 2023 peak of £267,574.
Properties Sold
39, Waterlily Close, Hednesford, Cannock WS12 2GN
| Today | See what it's worth now |
| 27 Mar 2026 | £254,000 |
| 4 Jun 2021 | £215,000 |
92, John Street, Wimblebury, Cannock WS12 2RL
| Today | See what it's worth now |
| 6 Mar 2026 | £185,000 |
| 30 Jun 1997 | £42,250 |
No other historical records.
10, Keys Park Road, Littleworth, Cannock WS12 2GW
| Today | See what it's worth now |
| 5 Mar 2026 | £350,000 |
| 20 Oct 2017 | £229,000 |
72, John Street, Wimblebury, Cannock WS12 2RL
| Today | See what it's worth now |
| 27 Feb 2026 | £197,000 |
| 15 Apr 2011 | £93,000 |
39, Nelson Drive, Wimblebury, Cannock WS12 2GF
| Today | See what it's worth now |
| 27 Feb 2026 | £177,000 |
| 3 Feb 2017 | £120,000 |
20, Fremantle Drive, Heath Hayes, Cannock WS12 2GY
| Today | See what it's worth now |
| 6 Feb 2026 | £182,500 |
| 27 Jun 2018 | £137,500 |
53, Brisbane Way, Heath Hayes, Cannock WS12 2GR

| Today | See what it's worth now |
| 30 Jan 2026 | £450,000 |
| 28 Oct 2013 | £240,000 |
47, Wimblebury Road, Hednesford, Cannock WS12 0FW
| Today | See what it's worth now |
| 16 Jan 2026 | £210,000 |
| 16 Aug 2004 | £134,995 |
No other historical records.
2, Glover Street, Wimblebury, Cannock WS12 2RS
| Today | See what it's worth now |
| 19 Dec 2025 | £190,000 |
| 26 Nov 1999 | £47,950 |
No other historical records.
19, Brisbane Way, Heath Hayes, Cannock WS12 2GR
| Today | See what it's worth now |
| 5 Dec 2025 | £385,000 |
| 26 Feb 1999 | £87,995 |
No other historical records.
10, Watermint Close, Hednesford, Cannock WS12 2GL
| Today | See what it's worth now |
| 5 Dec 2025 | £390,000 |
| 23 Oct 2012 | £183,000 |
14, Waterlily Close, Hednesford, Cannock WS12 2GN
| Today | See what it's worth now |
| 28 Nov 2025 | £360,000 |
| 23 Sep 2013 | £177,000 |
29, Horseshoe Drive, Cannock WS12 0FR
| Today | See what it's worth now |
| 21 Nov 2025 | £215,000 |
| 17 Sep 2004 | £123,995 |
No other historical records.
12, Victory Close, Cannock WS12 2GB
| Today | See what it's worth now |
| 4 Nov 2025 | £172,250 |
| 25 May 2021 | £140,000 |
16, Brisbane Way, Heath Hayes, Cannock WS12 2GR
| Today | See what it's worth now |
| 31 Oct 2025 | £465,000 |
| 17 May 2002 | £175,000 |
72, Kings Croft, Wimblebury, Cannock WS12 2GT
| Today | See what it's worth now |
| 10 Oct 2025 | £375,000 |
| 23 Jul 1999 | £97,500 |
No other historical records.
54, Arthur Street, Wimblebury, Cannock WS12 2RY
| Today | See what it's worth now |
| 3 Oct 2025 | £135,000 |
No other historical records.
17, Fremantle Drive, Heath Hayes, Cannock WS12 2GY
| Today | See what it's worth now |
| 19 Sep 2025 | £201,000 |
| 24 Mar 2005 | £116,000 |
5, Bryans Way, Wimblebury, Cannock WS12 0HX
| Today | See what it's worth now |
| 8 Sep 2025 | £192,000 |
| 30 Jan 2023 | £180,000 |
4, Barn Way, Cannock WS12 0FP
| Today | See what it's worth now |
| 29 Aug 2025 | £425,000 |
| 29 Jun 2009 | £224,000 |
27, Adelaide Drive, Heath Hayes, Cannock WS12 2GP
| Today | See what it's worth now |
| 21 Aug 2025 | £360,000 |
| 25 Jun 1999 | £78,500 |
No other historical records.
14, Watersmead Close, Hednesford, Cannock WS12 2GJ
| Today | See what it's worth now |
| 15 Aug 2025 | £287,500 |
| 31 Aug 2001 | £98,000 |
21, Victory Close, Cannock WS12 2GB
| Today | See what it's worth now |
| 29 Jul 2025 | £258,000 |
| 28 May 2004 | £151,000 |

Source Acknowledgement: © Crown copyright. England and Wales house price data is publicly available information produced by the HM Land Registry.This material was last updated on 9 July 2026. It covers the period from 1 January 1995 to 30 April 2026 and contains property transactions which have been registered during that period. Contains HM Land Registry data © Crown copyright and database right 2026. This data is licensed under the Open Government Licence v3.0.
Disclaimer: Rightmove.co.uk provides this HM Land Registry data "as is". The burden for fitness of the data relies completely with the user and is provided for informational purposes only. No warranty, express or implied, is given relating to the accuracy of content of the HM Land Registry data and Rightmove does not accept any liability for error or omission. If you have found an error with the data or need further information please contact HM Land Registry.
Permitted Use: Viewers of this Information are granted permission to access this Crown copyright material and to download it onto electronic, magnetic, optical or similar storage media provided that such activities are for private research, study or in-house use only. Any other use of the material requires the formal written permission of Land Registry which can be requested from us, and is subject to an additional licence and associated charge.
Rightmove takes no liability for your use of, or reliance on, Rightmove's Instant Valuation due to the limitations of our tracking tool listed here. Use of this tool is taken entirely at your own risk. All rights reserved.