
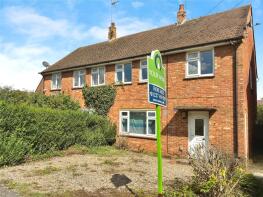
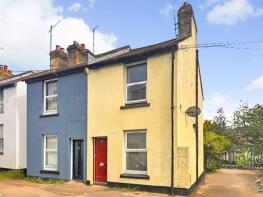
House Prices in Wincheap
House prices in Wincheap have an overall average of £305,523 over the last year.
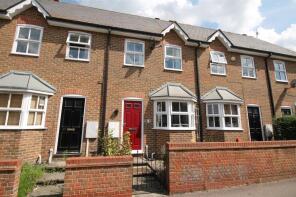
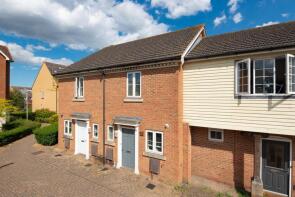
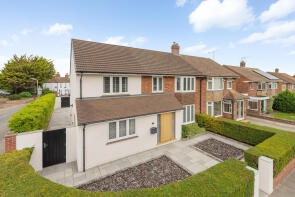
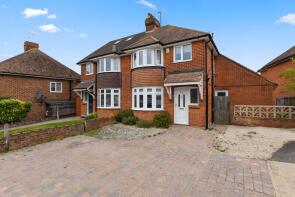
The majority of properties sold in Wincheap during the last year were terraced properties, selling for an average price of £276,900. Semi-detached properties sold for an average of £327,938, with flats fetching £181,600.
Overall, the historical sold prices in Wincheap over the last year were 1% down on the previous year and 4% down on the 2019 peak of £318,330.
Properties Sold
79, Heaton Road, Canterbury CT1 3QA
| Today | See what it's worth now |
| 17 Apr 2026 | £437,000 |
| 12 Jul 2013 | £242,500 |
23, Lancaster Road, Canterbury CT1 3QE
| Today | See what it's worth now |
| 25 Mar 2026 | £500,000 |
| 30 Nov 2009 | £300,000 |
No other historical records.
93, Heaton Road, Canterbury CT1 3QA
| Today | See what it's worth now |
| 11 Mar 2026 | £416,000 |
| 19 Apr 2024 | £230,000 |
No other historical records.
9, Durham Close, Canterbury CT1 3QL
| Today | See what it's worth now |
| 6 Mar 2026 | £328,000 |
| 19 Nov 2013 | £215,000 |
No other historical records.
10, Ivy Place, Canterbury CT1 3ST
| Today | See what it's worth now |
| 6 Mar 2026 | £250,000 |
| 24 Sep 2021 | £220,000 |
133, Wincheap, Canterbury CT1 3SE
| Today | See what it's worth now |
| 6 Mar 2026 | £225,000 |
| 7 Jan 2013 | £130,000 |
No other historical records.
70, Martyrs' Field Road, Canterbury CT1 3PU
| Today | See what it's worth now |
| 2 Mar 2026 | £368,000 |
| 3 Oct 2003 | £182,500 |
54, Claremont Place, Canterbury CT1 3SU

| Today | See what it's worth now |
| 27 Feb 2026 | £300,000 |
| 14 May 2014 | £224,000 |
No other historical records.
36, Gilbert Way, Canterbury CT1 3JD
| Today | See what it's worth now |
| 25 Feb 2026 | £450,000 |
| 17 Jul 2009 | £260,000 |
14, Martyrs' Field Road, Canterbury CT1 3PT
| Today | See what it's worth now |
| 20 Feb 2026 | £287,500 |
| 1 Apr 2021 | £287,000 |
7, Gilbert Way, Canterbury CT1 3RE
| Today | See what it's worth now |
| 18 Feb 2026 | £185,000 |
| 28 Oct 2005 | £162,500 |
14, New Street, Off York Road, Canterbury CT1 3SS
| Today | See what it's worth now |
| 13 Feb 2026 | £270,000 |
| 22 Aug 2003 | £154,995 |
2, Horseshoe Mews, Canterbury CT1 3BP
| Today | See what it's worth now |
| 12 Feb 2026 | £225,000 |
| 16 Nov 2010 | £165,000 |
No other historical records.
3, Tudor Road, Canterbury CT1 3SY
| Today | See what it's worth now |
| 5 Feb 2026 | £300,000 |
| 3 May 2024 | £249,300 |
28, Hollow Lane, Canterbury CT1 3SA
| Today | See what it's worth now |
| 30 Jan 2026 | £304,750 |
| 10 Dec 2018 | £295,000 |
10, Gilbert Way, Canterbury CT1 3JD
| Today | See what it's worth now |
| 21 Jan 2026 | £310,000 |
| 20 Dec 2022 | £345,000 |
18, Henry Court, Gordon Road, Canterbury CT1 3PL
| Today | See what it's worth now |
| 16 Jan 2026 | £290,000 |
| 8 Nov 2017 | £275,000 |
13a, Seymour Place, Canterbury CT1 3SF

| Today | See what it's worth now |
| 12 Jan 2026 | £183,000 |
| 23 Sep 2005 | £150,000 |
1 2, Lime Kiln Road, Canterbury CT1 3QH
| Today | See what it's worth now |
| 18 Dec 2025 | £370,000 |
No other historical records.
15, Scott Avenue, Canterbury CT1 3RU
| Today | See what it's worth now |
| 17 Dec 2025 | £275,000 |
| 18 Jan 2019 | £280,000 |
1, Hollowmede, Canterbury CT1 3SD
| Today | See what it's worth now |
| 16 Dec 2025 | £542,500 |
| 19 Jan 2007 | £228,000 |
86, Heaton Road, Canterbury CT1 3QA
| Today | See what it's worth now |
| 12 Dec 2025 | £470,000 |
| 16 Jan 2004 | £185,000 |
No other historical records.
3, Cambridge Road, Canterbury CT1 3QG
| Today | See what it's worth now |
| 19 Nov 2025 | £250,000 |
No other historical records.
Source Acknowledgement: © Crown copyright. England and Wales house price data is publicly available information produced by the HM Land Registry.This material was last updated on 9 July 2026. It covers the period from 1 January 1995 to 30 April 2026 and contains property transactions which have been registered during that period. Contains HM Land Registry data © Crown copyright and database right 2026. This data is licensed under the Open Government Licence v3.0.
Disclaimer: Rightmove.co.uk provides this HM Land Registry data "as is". The burden for fitness of the data relies completely with the user and is provided for informational purposes only. No warranty, express or implied, is given relating to the accuracy of content of the HM Land Registry data and Rightmove does not accept any liability for error or omission. If you have found an error with the data or need further information please contact HM Land Registry.
Permitted Use: Viewers of this Information are granted permission to access this Crown copyright material and to download it onto electronic, magnetic, optical or similar storage media provided that such activities are for private research, study or in-house use only. Any other use of the material requires the formal written permission of Land Registry which can be requested from us, and is subject to an additional licence and associated charge.
Rightmove takes no liability for your use of, or reliance on, Rightmove's Instant Valuation due to the limitations of our tracking tool listed here. Use of this tool is taken entirely at your own risk. All rights reserved.