
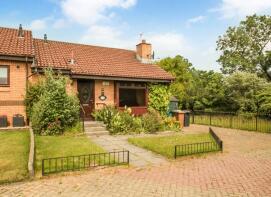
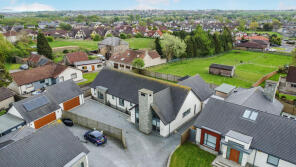
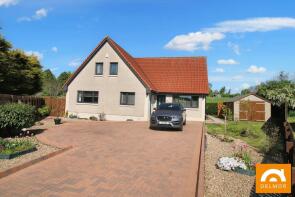
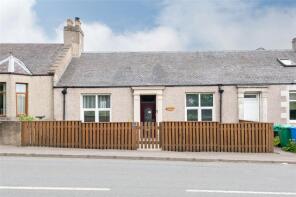
House Prices in Windygates
House prices in Windygates have an overall average of £271,345 over the last year.
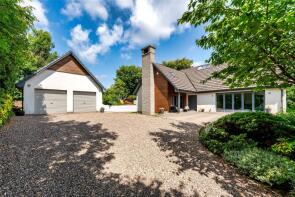
The majority of properties sold in Windygates during the last year were detached properties, selling for an average price of £387,756. Semi-detached properties sold for an average of £169,021, with terraced properties fetching £155,438.
Overall, the historical sold prices in Windygates over the last year were 62% up on the previous year and 46% up on the 2022 peak of £185,794.
Properties Sold
20, Bankhead Place, Leven KY8 5DP
| Today | See what it's worth now |
| 28 Apr 2026 | £139,251 |
| 22 Jun 2017 | £95,000 |
15, Fernhill Drive, Windygates KY8 5ED

| Today | See what it's worth now |
| 15 Apr 2026 | £342,500 |
No other historical records.
Woodlands, Milton Road, Leven KY8 5DQ
| Today | See what it's worth now |
| 30 Mar 2026 | £235,000 |
| 1 Oct 2018 | £166,315 |
3 Hamilton Place, Leven Road, Leven KY8 5DA
| Today | See what it's worth now |
| 20 Mar 2026 | £46,000 |
| 17 May 2017 | £42,000 |
4, Red Buildings, Kennoway Road, Windygates KY8 5BY
| Today | See what it's worth now |
| 24 Feb 2026 | £75,000 |
No other historical records.
16, Durie Bank, Windygates KY8 5FG
| Today | See what it's worth now |
| 23 Feb 2026 | £255,000 |
No other historical records.
Glencona, Haughmill Lane, Windygates KY8 5DH
| Today | See what it's worth now |
| 2 Feb 2026 | £237,500 |
No other historical records.
28, Fernbank Drive, Leven KY8 5FD
| Today | See what it's worth now |
| 26 Jan 2026 | £439,000 |
| 12 Aug 2013 | £240,000 |
28, Cameron Crescent, Windygates KY8 5EB
| Today | See what it's worth now |
| 9 Dec 2025 | £250,000 |
| 20 Jul 2017 | £158,000 |
No other historical records.
The Hideaway, Main Street, Balcurvie, Windygates KY8 5DS
| Today | See what it's worth now |
| 3 Dec 2025 | £525,000 |
No other historical records.
Melville Bank, Main Street, Balcurvie, Windygates KY8 5DT
| Today | See what it's worth now |
| 24 Nov 2025 | £130,000 |
No other historical records.
7, Balcurvie Small Holdings, Windygates KY8 5RZ
| Today | See what it's worth now |
| 19 Nov 2025 | £450,000 |
No other historical records.
10, Fernbank Drive, Leven KY8 5FD
| Today | See what it's worth now |
| 11 Nov 2025 | £350,000 |
| 21 Mar 2007 | £212,500 |
Orchard House, Station Road, Leven KY8 5RJ
| Today | See what it's worth now |
| 7 Nov 2025 | £650,000 |
| 6 Aug 2015 | £420,000 |
No other historical records.
30, Cameron Crescent, Windygates KY8 5EB
| Today | See what it's worth now |
| 3 Nov 2025 | £230,106 |
No other historical records.
7, Henderson Park, Leven KY8 5DL
| Today | See what it's worth now |
| 20 Oct 2025 | £125,000 |
| 11 Aug 2010 | £95,100 |
No other historical records.
16, Fernbank Avenue, Leven KY8 5FA
| Today | See what it's worth now |
| 17 Oct 2025 | £240,000 |
| 6 Aug 2003 | £20,000 |
No other historical records.
4, Hawthorn Bank, Kennoway Road, Windygates KY8 5BX
| Today | See what it's worth now |
| 30 Sep 2025 | £195,000 |
No other historical records.
37, Fernbank Drive, Leven KY8 5FD
| Today | See what it's worth now |
| 22 Sep 2025 | £333,000 |
| 26 Aug 2009 | £195,000 |
23, Johnston Terrace, Leven KY8 5DW
| Today | See what it's worth now |
| 17 Sep 2025 | £110,000 |
| 20 May 2008 | £90,000 |
3, Balcurvie Hills, Balcurvie, Windygates KY8 5FJ
| Today | See what it's worth now |
| 11 Sep 2025 | £463,575 |
No other historical records.
25, Station Road, Leven KY8 5DB
| Today | See what it's worth now |
| 18 Aug 2025 | £50,000 |
| 22 Sep 2004 | £20,080 |
No other historical records.
1a, Fernbank Avenue, Leven KY8 5FA
| Today | See what it's worth now |
| 13 Aug 2025 | £370,000 |
| 31 Aug 2021 | £305,000 |
Source Acknowledgement: © Crown copyright. Scottish house price data is publicly available information produced by the Registers of Scotland. Material has been reproduced with the permission of the Keeper of the Registers of Scotland and contains data compiled by Registers of Scotland. For further information, please contact data@ros.gov.uk. Please note the dates shown here relate to the property's registered date not sold date.This material was last updated on 10 July 2026. It covers the period from 8 December 1987 to 30 April 2026 and contains property transactions which have been registered during that period.
Disclaimer: Rightmove.co.uk provides this Registers of Scotland data "as is". The burden for fitness of the data relies completely with the user and is provided for informational purposes only. No warranty, express or implied, is given relating to the accuracy of content of the Registers of Scotland data and Rightmove plc does not accept any liability for error or omission. If you have found an error with the data or need further information please contact data@ros.gov.uk
Permitted Use: The Registers of Scotland allows the reproduction of the data which it provides to Rightmove.co.uk free of charge in any format or medium only for research, private study or for internal circulation within an organisation. This is subject to it being reproduced accurately and not used in a misleading context. The material must be acknowledged as Crown Copyright. You are not allowed to use this information for commercial purposes, nor must you copy, distribute, sell or publish the data in any way. For any other use of this material, please apply to the Registers of Scotland for a licence. You can do this online at www.ros.gov.uk, by email at data@ros.gov.uk or by writing to Business Development, Registers of Scotland, Meadowbank House, 153 London Road, Edinburgh EH8 7AU.
Rightmove takes no liability for your use of, or reliance on, Rightmove's Instant Valuation due to the limitations of our tracking tool listed here. Use of this tool is taken entirely at your own risk. All rights reserved.