
House Prices in Wolgarston
House prices in Wolgarston have an overall average of £294,433 over the last year.
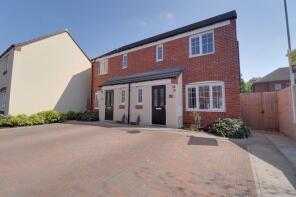
The majority of properties sold in Wolgarston during the last year were detached properties, selling for an average price of £385,974. Semi-detached properties sold for an average of £287,056, with terraced properties fetching £175,271.
Overall, the historical sold prices in Wolgarston over the last year were 5% down on the previous year and 3% up on the 2023 peak of £285,733.
Properties Sold
22, Nursery Drive, Stafford ST19 5SJ
| Today | See what it's worth now |
| 27 Mar 2026 | £312,000 |
| 4 May 2012 | £190,000 |
3, Teddesley House, Clay Street, Stafford ST19 5NE
| Today | See what it's worth now |
| 13 Mar 2026 | £125,000 |
| 29 Apr 2005 | £120,000 |
No other historical records.
16, Tempest Drive, Stafford ST19 5QF
| Today | See what it's worth now |
| 18 Feb 2026 | £265,000 |
| 26 May 2017 | £229,950 |
No other historical records.
3, Cowley Close, Stafford ST19 5SX
| Today | See what it's worth now |
| 18 Feb 2026 | £400,000 |
| 7 Oct 2016 | £290,000 |
No other historical records.
10, Walhouse Drive, Stafford ST19 5SP
| Today | See what it's worth now |
| 13 Feb 2026 | £399,950 |
| 29 Jan 2010 | £231,000 |
West Fields, Cannock Road, Stafford ST19 5DX
| Today | See what it's worth now |
| 13 Feb 2026 | £560,000 |
| 11 Dec 2014 | £400,000 |
No other historical records.
21, Kingfisher Walk, Stafford ST19 5DY
| Today | See what it's worth now |
| 4 Feb 2026 | £425,000 |
| 15 Dec 2016 | £277,500 |
16, Vale Gardens, Penkridge ST19 5LQ
| Today | See what it's worth now |
| 30 Jan 2026 | £240,000 |
| 14 Apr 2023 | £221,500 |
No other historical records.
28, Prospero Close, Stafford ST19 5QU
| Today | See what it's worth now |
| 23 Jan 2026 | £232,500 |
| 19 Feb 2021 | £210,000 |
27, Sycamore Way, Stafford ST19 5FN
| Today | See what it's worth now |
| 21 Jan 2026 | £315,000 |
| 14 Dec 2022 | £285,950 |
No other historical records.
2, Teddesley House, Clay Street, Stafford ST19 5NE
| Today | See what it's worth now |
| 9 Jan 2026 | £161,000 |
| 28 May 2024 | £152,000 |
6, Chetwynd Close, Stafford ST19 5SU
| Today | See what it's worth now |
| 9 Jan 2026 | £400,000 |
| 4 May 2001 | £134,950 |
No other historical records.
11, Aston Close, Stafford ST19 5TF

| Today | See what it's worth now |
| 8 Jan 2026 | £378,000 |
| 22 Dec 2016 | £269,950 |
No other historical records.
8, Grange Avenue, Penkridge ST19 5NW
| Today | See what it's worth now |
| 18 Dec 2025 | £140,000 |
No other historical records.
18, Shakespeare Drive, Stafford ST19 5PW
| Today | See what it's worth now |
| 17 Dec 2025 | £250,000 |
| 28 Apr 2022 | £220,000 |
36, Swallow Place, Lyne Hill, Stafford ST19 5QX
| Today | See what it's worth now |
| 16 Dec 2025 | £82,500 |
| 30 Aug 2019 | £97,174 |
No other historical records.
6, Capulet Way, Stafford ST19 5TR
| Today | See what it's worth now |
| 12 Dec 2025 | £107,250 |
No other historical records.
32, Hathaway Close, Stafford ST19 5PD
| Today | See what it's worth now |
| 5 Dec 2025 | £307,000 |
| 27 Feb 2017 | £229,950 |
No other historical records.
14, Macbeth Close, Stafford ST19 5TW
| Today | See what it's worth now |
| 5 Dec 2025 | £330,000 |
| 30 Sep 2020 | £279,950 |
No other historical records.
22, The Saplings, Stafford ST19 5DE
| Today | See what it's worth now |
| 5 Dec 2025 | £490,000 |
| 8 Aug 2014 | £290,000 |
34, Fallowfield Close, Penkridge ST19 5JR
| Today | See what it's worth now |
| 3 Dec 2025 | £130,000 |
No other historical records.
2, Chelford Close, Stafford ST19 5EJ
| Today | See what it's worth now |
| 1 Dec 2025 | £325,000 |
| 10 Dec 2021 | £206,000 |
10, Oakley Close, Stafford ST19 5ED
| Today | See what it's worth now |
| 1 Dec 2025 | £372,000 |
| 27 May 2011 | £210,000 |
No other historical records.
Source Acknowledgement: © Crown copyright. England and Wales house price data is publicly available information produced by the HM Land Registry.This material was last updated on 15 May 2026. It covers the period from 1 January 1995 to 31 March 2026 and contains property transactions which have been registered during that period. Contains HM Land Registry data © Crown copyright and database right 2026. This data is licensed under the Open Government Licence v3.0.
Disclaimer: Rightmove.co.uk provides this HM Land Registry data "as is". The burden for fitness of the data relies completely with the user and is provided for informational purposes only. No warranty, express or implied, is given relating to the accuracy of content of the HM Land Registry data and Rightmove does not accept any liability for error or omission. If you have found an error with the data or need further information please contact HM Land Registry.
Permitted Use: Viewers of this Information are granted permission to access this Crown copyright material and to download it onto electronic, magnetic, optical or similar storage media provided that such activities are for private research, study or in-house use only. Any other use of the material requires the formal written permission of Land Registry which can be requested from us, and is subject to an additional licence and associated charge.
Rightmove takes no liability for your use of, or reliance on, Rightmove's Instant Valuation due to the limitations of our tracking tool listed here. Use of this tool is taken entirely at your own risk. All rights reserved.