
House Prices in Wyberton
House prices in Wyberton have an overall average of £222,441 over the last year.
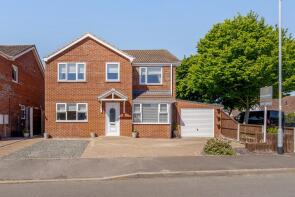
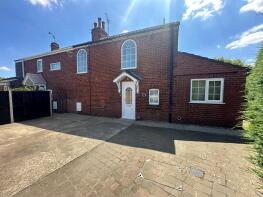
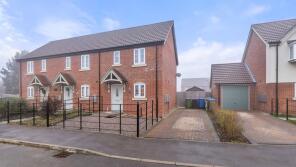
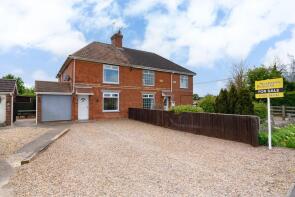
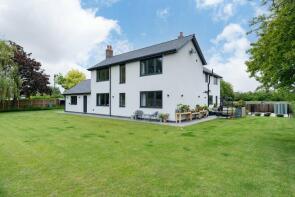
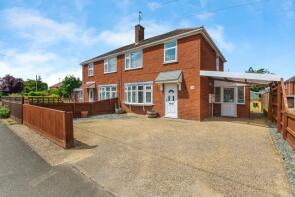
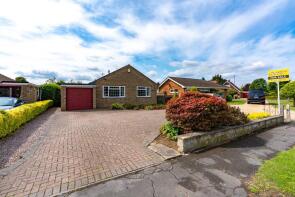
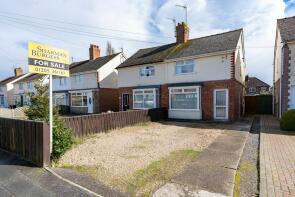
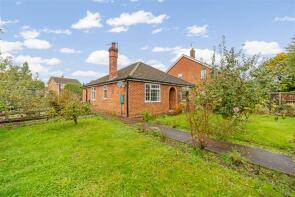
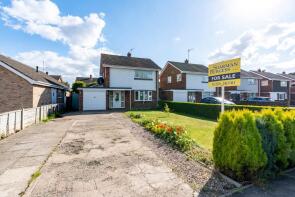
The majority of properties sold in Wyberton during the last year were detached properties, selling for an average price of £265,619. Semi-detached properties sold for an average of £163,643, with terraced properties fetching £164,375.
Overall, the historical sold prices in Wyberton over the last year were 5% up on the previous year and 8% down on the 2023 peak of £241,313.
Properties Sold
9, Saundergate Park, Wyberton, Boston PE21 7BU

| Today | See what it's worth now |
| 10 Apr 2026 | £162,500 |
| 24 Mar 2016 | £128,000 |
15, Saundergate Park, Wyberton, Boston PE21 7BU
| Today | See what it's worth now |
| 13 Mar 2026 | £202,500 |
| 13 Jun 2022 | £182,500 |
44, Deldale Road, Wyberton, Boston PE21 7BT
| Today | See what it's worth now |
| 12 Mar 2026 | £250,000 |
| 20 Oct 2016 | £155,000 |
27, Clarke Court, Wyberton, Boston PE21 7EE
| Today | See what it's worth now |
| 4 Mar 2026 | £85,000 |
| 11 Jan 2000 | £20,000 |
No other historical records.
36, Clarke Court, Wyberton, Boston PE21 7EE
| Today | See what it's worth now |
| 27 Feb 2026 | £97,000 |
| 3 May 2002 | £34,000 |
14, Spice Avenue, Wyberton, Boston PE21 7BQ
| Today | See what it's worth now |
| 25 Feb 2026 | £284,000 |
| 11 Dec 2009 | £107,000 |
No other historical records.
288, London Road, Wyberton, Boston PE21 7BA
| Today | See what it's worth now |
| 23 Feb 2026 | £125,000 |
| 30 Nov 2018 | £117,500 |
54, Field Drive, Wyberton, Boston PE21 7NG
| Today | See what it's worth now |
| 6 Feb 2026 | £160,000 |
| 28 Jul 2022 | £176,011 |
Coach House, Tytton Court, Wyberton, Boston PE21 7HT
| Today | See what it's worth now |
| 30 Jan 2026 | £185,000 |
No other historical records.
90, Tytton Lane West, Wyberton, Boston PE21 7HN
| Today | See what it's worth now |
| 19 Jan 2026 | £225,000 |
| 21 Sep 2012 | £113,000 |
No other historical records.
6, Delfield Road, Wyberton, Boston PE21 7BB

| Today | See what it's worth now |
| 16 Jan 2026 | £175,000 |
| 15 Jul 2011 | £103,000 |
50, Wells Place, Wyberton, Boston PE21 7NJ
| Today | See what it's worth now |
| 8 Jan 2026 | £220,000 |
| 3 Sep 2018 | £189,000 |
No other historical records.
52, Field Drive, Wyberton, Boston PE21 7NG
| Today | See what it's worth now |
| 19 Dec 2025 | £245,000 |
| 30 Oct 2020 | £235,950 |
No other historical records.
Sandalwood, Ralphs Lane, Frampton, Boston PE20 1QU
| Today | See what it's worth now |
| 19 Dec 2025 | £255,000 |
No other historical records.
3, Parker Close, Wyberton, Boston PE21 7FW
| Today | See what it's worth now |
| 15 Dec 2025 | £393,000 |
| 31 Mar 2023 | £200,000 |
No other historical records.
23, Tytton Lane East, Wyberton, Boston PE21 7HW
| Today | See what it's worth now |
| 5 Dec 2025 | £350,000 |
| 3 Nov 2003 | £200,000 |
41, Causeway, Wyberton, Boston PE21 7AR
| Today | See what it's worth now |
| 2 Dec 2025 | £200,000 |
| 29 Dec 2009 | £127,000 |
Greenways, Low Road, Wyberton, Boston PE21 7AP
| Today | See what it's worth now |
| 1 Dec 2025 | £475,000 |
| 22 Nov 2019 | £290,000 |
No other historical records.
191, Parthian Avenue, Wyberton, Boston PE21 7DS
| Today | See what it's worth now |
| 28 Nov 2025 | £170,000 |
| 26 May 2017 | £120,000 |
48, Tytton Lane West, Wyberton, Boston PE21 7HL
| Today | See what it's worth now |
| 31 Oct 2025 | £186,000 |
| 28 Nov 2002 | £122,500 |
No other historical records.
8, Granville Avenue, Wyberton, Boston PE21 7BY
| Today | See what it's worth now |
| 20 Oct 2025 | £143,000 |
| 24 Mar 2017 | £118,000 |
55, Wells Place, Wyberton, Boston PE21 7NJ

| Today | See what it's worth now |
| 16 Oct 2025 | £245,000 |
| 18 Dec 2018 | £219,950 |
No other historical records.
16, Dunlin Close, Wyberton, Boston PE21 7FJ
| Today | See what it's worth now |
| 14 Oct 2025 | £150,000 |
No other historical records.
Source Acknowledgement: © Crown copyright. England and Wales house price data is publicly available information produced by the HM Land Registry.This material was last updated on 9 July 2026. It covers the period from 1 January 1995 to 30 April 2026 and contains property transactions which have been registered during that period. Contains HM Land Registry data © Crown copyright and database right 2026. This data is licensed under the Open Government Licence v3.0.
Disclaimer: Rightmove.co.uk provides this HM Land Registry data "as is". The burden for fitness of the data relies completely with the user and is provided for informational purposes only. No warranty, express or implied, is given relating to the accuracy of content of the HM Land Registry data and Rightmove does not accept any liability for error or omission. If you have found an error with the data or need further information please contact HM Land Registry.
Permitted Use: Viewers of this Information are granted permission to access this Crown copyright material and to download it onto electronic, magnetic, optical or similar storage media provided that such activities are for private research, study or in-house use only. Any other use of the material requires the formal written permission of Land Registry which can be requested from us, and is subject to an additional licence and associated charge.
Rightmove takes no liability for your use of, or reliance on, Rightmove's Instant Valuation due to the limitations of our tracking tool listed here. Use of this tool is taken entirely at your own risk. All rights reserved.