
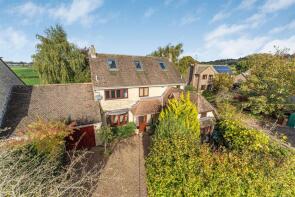
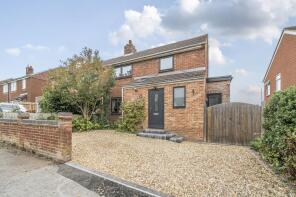
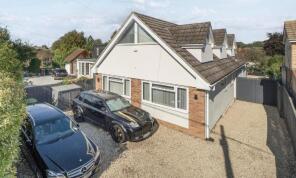
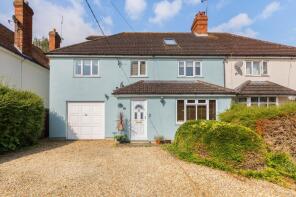
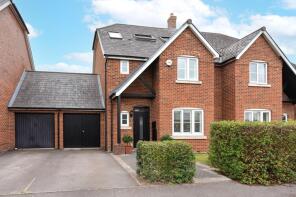
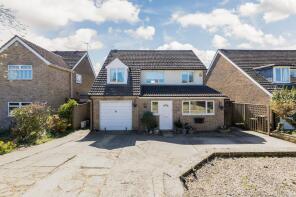
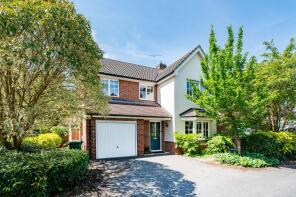
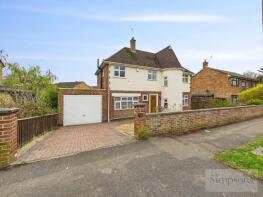
House Prices in Youlbury
House prices in Youlbury have an overall average of £642,581 over the last year.
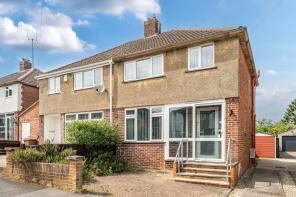
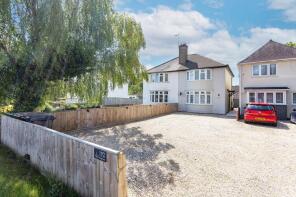
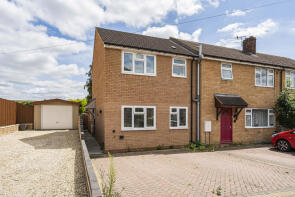
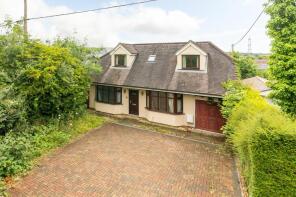
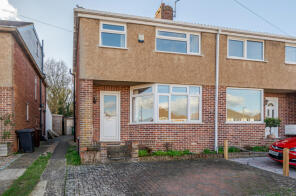
The majority of properties sold in Youlbury during the last year were detached properties, selling for an average price of £806,184. Semi-detached properties sold for an average of £529,808, with terraced properties fetching £337,667.
Overall, the historical sold prices in Youlbury over the last year were 13% up on the previous year and 15% down on the 2022 peak of £758,011.
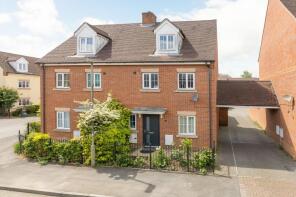
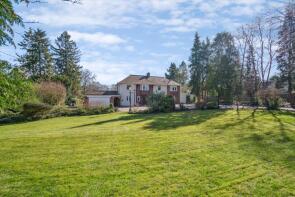
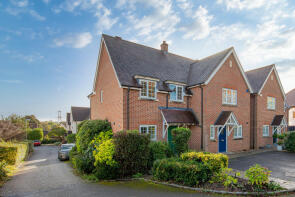
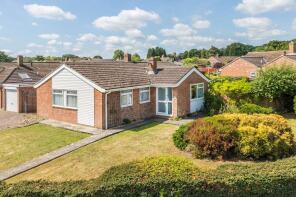
Properties Sold
75, Wootton Village, Boars Hill, Oxford OX1 5HP
| Today | See what it's worth now |
| 13 Feb 2026 | £832,500 |
No other historical records.
99, Poplar Grove, Kennington, Oxford OX1 5QR
| Today | See what it's worth now |
| 9 Feb 2026 | £600,000 |
| 12 Jan 2016 | £374,950 |
115, Upper Road, Kennington, Oxford OX1 5LW
| Today | See what it's worth now |
| 9 Feb 2026 | £810,000 |
| 10 Nov 2006 | £250,000 |
No other historical records.
11, Cumnor Road, Boars Hill, Oxford OX1 5JP
| Today | See what it's worth now |
| 30 Jan 2026 | £625,000 |
| 20 Nov 2003 | £330,000 |
11, Robinson Road, Wootton, Oxford OX1 5LE
| Today | See what it's worth now |
| 18 Dec 2025 | £347,000 |
| 20 Dec 2005 | £224,996 |
No other historical records.
Heverlee, Hinksey Hill, Oxford OX1 5BE
| Today | See what it's worth now |
| 18 Dec 2025 | £1,535,000 |
| 27 Sep 1996 | £315,000 |
No other historical records.
1, Ross Court, Kennington, Oxford OX1 5AD
| Today | See what it's worth now |
| 11 Dec 2025 | £406,000 |
| 7 Jun 2002 | £192,995 |
No other historical records.
8, Liddiard Close, Kennington, Oxford OX1 5RY
| Today | See what it's worth now |
| 5 Dec 2025 | £467,000 |
| 29 Mar 2006 | £316,000 |
32, Cranbrook Drive, Kennington, Oxford OX1 5RR
| Today | See what it's worth now |
| 28 Nov 2025 | £578,000 |
| 30 Jan 2009 | £285,000 |
13, Cranbrook Drive, Kennington, Oxford OX1 5RR
| Today | See what it's worth now |
| 21 Nov 2025 | £615,000 |
| 23 Jul 1999 | £155,000 |
2, The Paddock, Kennington, Oxford OX1 5SB
| Today | See what it's worth now |
| 19 Nov 2025 | £700,000 |
| 10 Aug 2007 | £265,000 |
27, St Swithuns Road, Kennington, Oxford OX1 5PU
| Today | See what it's worth now |
| 18 Nov 2025 | £470,000 |
No other historical records.
8, Kirk Close, Kennington, Oxford OX1 5PX
| Today | See what it's worth now |
| 31 Oct 2025 | £598,500 |
| 30 Jan 2009 | £230,000 |
No other historical records.
22, Poplar Grove, Kennington, Oxford OX1 5QW
| Today | See what it's worth now |
| 15 Oct 2025 | £422,500 |
| 29 Aug 2008 | £250,000 |
No other historical records.
2 Lowmead, Henwood, Wootton, Oxford OX1 5JX
| Today | See what it's worth now |
| 13 Oct 2025 | £550,000 |
| 30 Jun 2000 | £285,000 |
1, St Lawrence Road, South Hinksey, Oxford OX1 5AZ
| Today | See what it's worth now |
| 3 Oct 2025 | £780,000 |
No other historical records.
10, Bagley Close, Kennington, Oxford OX1 5LS
| Today | See what it's worth now |
| 30 Sep 2025 | £365,000 |
No other historical records.
192, The Avenue, Kennington, Oxford OX1 5RN
| Today | See what it's worth now |
| 26 Sep 2025 | £430,000 |
| 31 Aug 2018 | £330,000 |
155f, The Avenue, Kennington, Oxford OX1 5QZ
| Today | See what it's worth now |
| 26 Sep 2025 | £245,000 |
| 24 Nov 2021 | £228,500 |
24, Grundy Crescent, Kennington, Oxford OX1 5PS
| Today | See what it's worth now |
| 17 Sep 2025 | £587,000 |
| 27 Feb 2004 | £247,500 |
105a, Poplar Grove, Kennington, Oxford OX1 5QR
| Today | See what it's worth now |
| 12 Sep 2025 | £425,000 |
No other historical records.
Flat 4, 28 Tomline Court, The Avenue, Kennington, Oxford OX1 5PN

| Today | See what it's worth now |
| 4 Sep 2025 | £312,500 |
| 2 Nov 2018 | £300,000 |
No other historical records.
157, The Avenue, Kennington, Oxford OX1 5QZ
| Today | See what it's worth now |
| 4 Sep 2025 | £655,000 |
| 8 Sep 2006 | £395,000 |
176, Poplar Grove, Kennington, Oxford OX1 5QT
| Today | See what it's worth now |
| 29 Aug 2025 | £477,000 |
| 17 May 2002 | £205,000 |
No other historical records.
65, Bagley Close, Kennington, Oxford OX1 5LT
| Today | See what it's worth now |
| 29 Aug 2025 | £425,000 |
No other historical records.
Source Acknowledgement: © Crown copyright. England and Wales house price data is publicly available information produced by the HM Land Registry.This material was last updated on 9 April 2026. It covers the period from 1 January 1995 to 27 February 2026 and contains property transactions which have been registered during that period. Contains HM Land Registry data © Crown copyright and database right 2026. This data is licensed under the Open Government Licence v3.0.
Disclaimer: Rightmove.co.uk provides this HM Land Registry data "as is". The burden for fitness of the data relies completely with the user and is provided for informational purposes only. No warranty, express or implied, is given relating to the accuracy of content of the HM Land Registry data and Rightmove does not accept any liability for error or omission. If you have found an error with the data or need further information please contact HM Land Registry.
Permitted Use: Viewers of this Information are granted permission to access this Crown copyright material and to download it onto electronic, magnetic, optical or similar storage media provided that such activities are for private research, study or in-house use only. Any other use of the material requires the formal written permission of Land Registry which can be requested from us, and is subject to an additional licence and associated charge.
Map data ©OpenStreetMap contributors.
Rightmove takes no liability for your use of, or reliance on, Rightmove's Instant Valuation due to the limitations of our tracking tool listed here. Use of this tool is taken entirely at your own risk. All rights reserved.