October 2025 housing market update
Key summary
- Average asking price: £371,422
(+0.3% since last month, -0.1% since last year) - Sales agreed year-to-date: +5% vs. 2024
- October price rise: +0.3% (below the 10-year average of +1.1%)
- Regional picture: London house prices down -1.4% annually, while Scotland, Wales and northern regions all up at least +1%
- Activity: Buyer demand and new listings both down -5% vs. September 2024
Asking prices edged up by 0.3% this month, bringing the average new seller price to £371,422. But compared to this time last year, prices are fractionally down (-0.1%). It’s a sign that while the market is holding firm, many movers are pausing to see what unfolds, with the Autumn Budget just around the corner.
The housing market at a glance:
October is usually a time when asking prices for homes pick up after the summer. But this year, the bounce has been more of a gentle nudge. With more homes available than we’ve seen in a decade, buyers have more choice – and that’s meaning house price growth is much smaller than we usually see at this time of year.
There’s also a sense of caution. Rumours of what could be announced in the upcoming Budget have created uncertainty, particularly in higher-priced areas where widely rumoured tax changes could have a bigger impact. That said, sales agreed are up 5% compared to last year, and more sellers are listing their homes. It’s a sign that while people may be taking longer to decide, they’re still moving when the time feels right.
| Month | Average house price | Monthly change | Annual change |
|---|---|---|---|
| October 2025 | £371,422 | +0.3% | -0.1% |
| September 2025 | £370,257 | +0.4% | -0.1% |
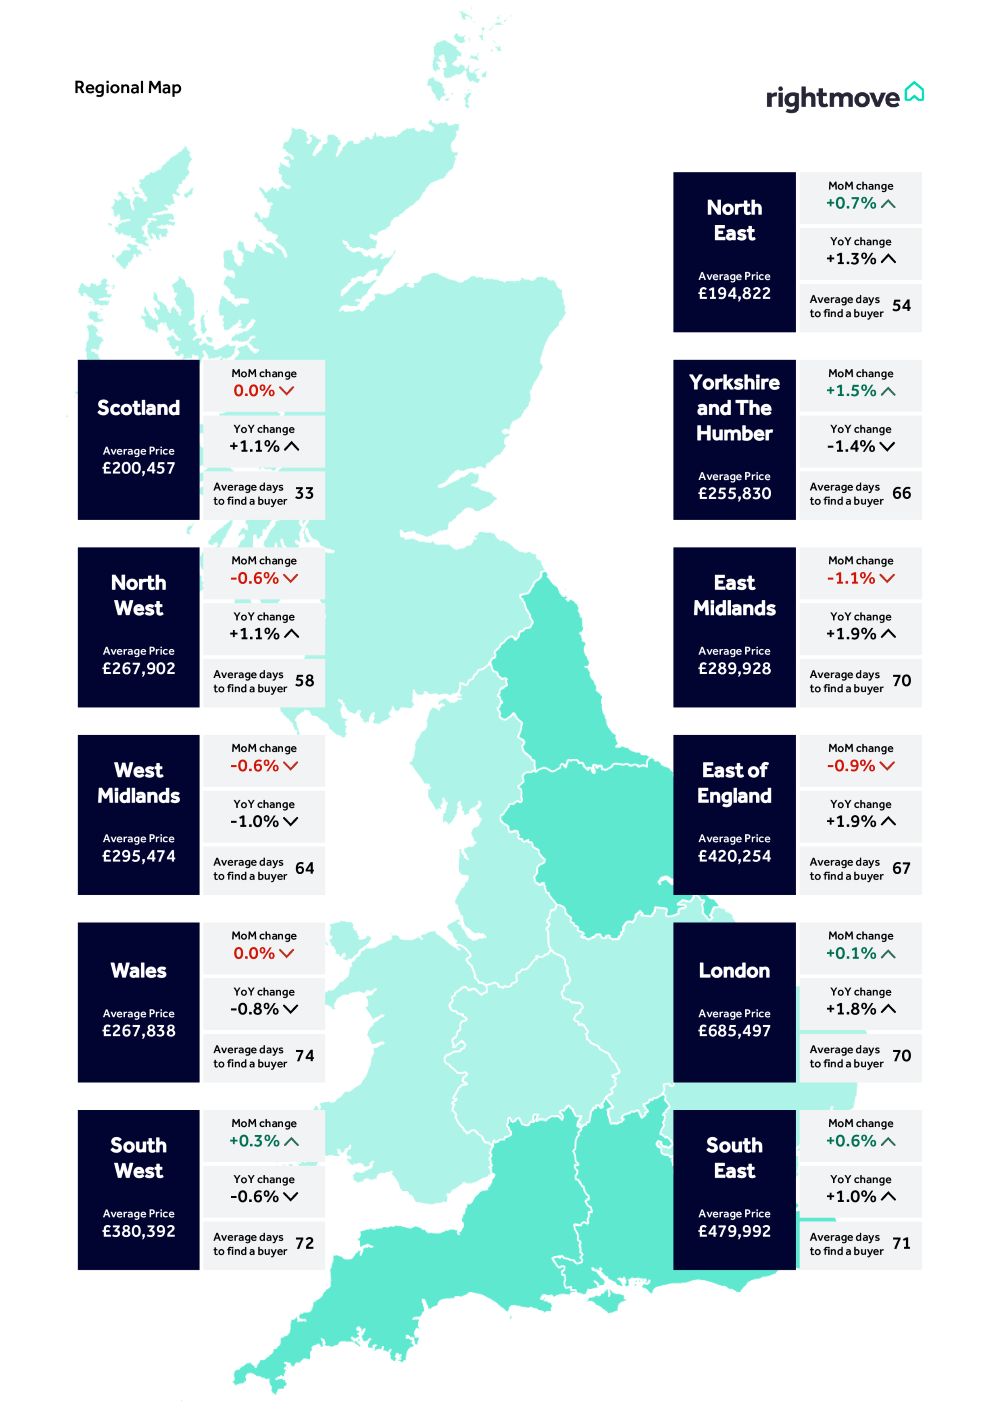
Regional house price trends
The divide in price changes between north and south is becoming more pronounced. Southern regions, including London and the South West, are seeing annual price falls. Meanwhile, areas like the North West and Scotland are seeing growth, driven by cheaper house prices and shorter time to sell.
| Region | Annual change | Key observation |
|---|---|---|
| London | -1.4% | Affected by stamp duty increases and Budget uncertainty |
| South West | -1.0% | High supply keeping prices subdued |
| North West | +1.9% | Affordable pricing driving activity |
| Scotland | +1.3% | Fastest time to secure buyers |
Source: Rightmove House Price Index, October 2025
Looking back to last year
This time last year, the market was boosted by the first Base Rate cut in four years and early moves to beat this April’s stamp duty rise. So, while activity has dipped, it’s partly because we’re comparing against a strong period.
Our property expert, Colleen Babcock, says: “Despite the overall resilience of the 2025 housing market, we’ve not got enough pent-up momentum or recent positive sentiment to spur the usual autumn bounce in property prices. We’re experiencing a decade-high level of property choice for buyers, which means that sellers who are serious about selling have had to acknowledge their limited pricing power and moderate their price expectations.”
Matt Smith, our mortgage expert says: “Average mortgage rates, particularly two-year fixed rates, are still lower than they were a year ago. Combined with flat house prices and improved lending criteria, many home-movers may find their affordability significantly improved compared with last year.”
The importance of pricing
With property choice at its highest level in a decade, buyers have the upper hand right now. Our data shows just how crucial it is to get your pricing right from the start – homes that receive an enquiry on their first day of marketing are 22% more likely to secure a buyer than those that take over two weeks to get their first enquiry.
National average house prices by property type
| Sector | October 2025 | September 2025 | Monthly change | Annual change |
|---|---|---|---|---|
| First time buyers | £226,869 | £227,133 | -0.1% | +0.0% |
| Second-steppers | £343,988 | £345,058 | -0.3% | +0.2% |
| Top of the ladder | £676,200 | £669,139 | 1.1% | +0.1% |
What could the Autumn Budget mean for the housing market?
There is a lot of talk about potential property tax changes that could affect higher-priced homes.
Our data shows that nationally, 40% of first-time buyers pay no stamp duty at the moment, on account of the higher thresholds for paying the tax if you’re buying your first home. In contrast, just 5% of movers who aren’t first-time buyers avoid stamp duty.
Our property expert, Colleen Babcock, says: It’s encouraging that housing continues to be a political priority with some radical changes being suggested. We’re all for policies which would speed up the home buying and selling process and make it easier for all involved, and we’re looking forward to helping the government with our twenty-five years of housing market data.
Rightmove has been calling for stamp duty reform for some time now, and we believe that abolishing it completely would remove one of the biggest barriers to movement. We hope the Government considers how they could improve it in November’s Budget. Increasing the thresholds would be a help, but going further would be a huge step forward.”
How have asking prices changed over the past 5 years?

How much are first-time buyers spending each month on average?

How long does it take to find a buyer for a home on average?