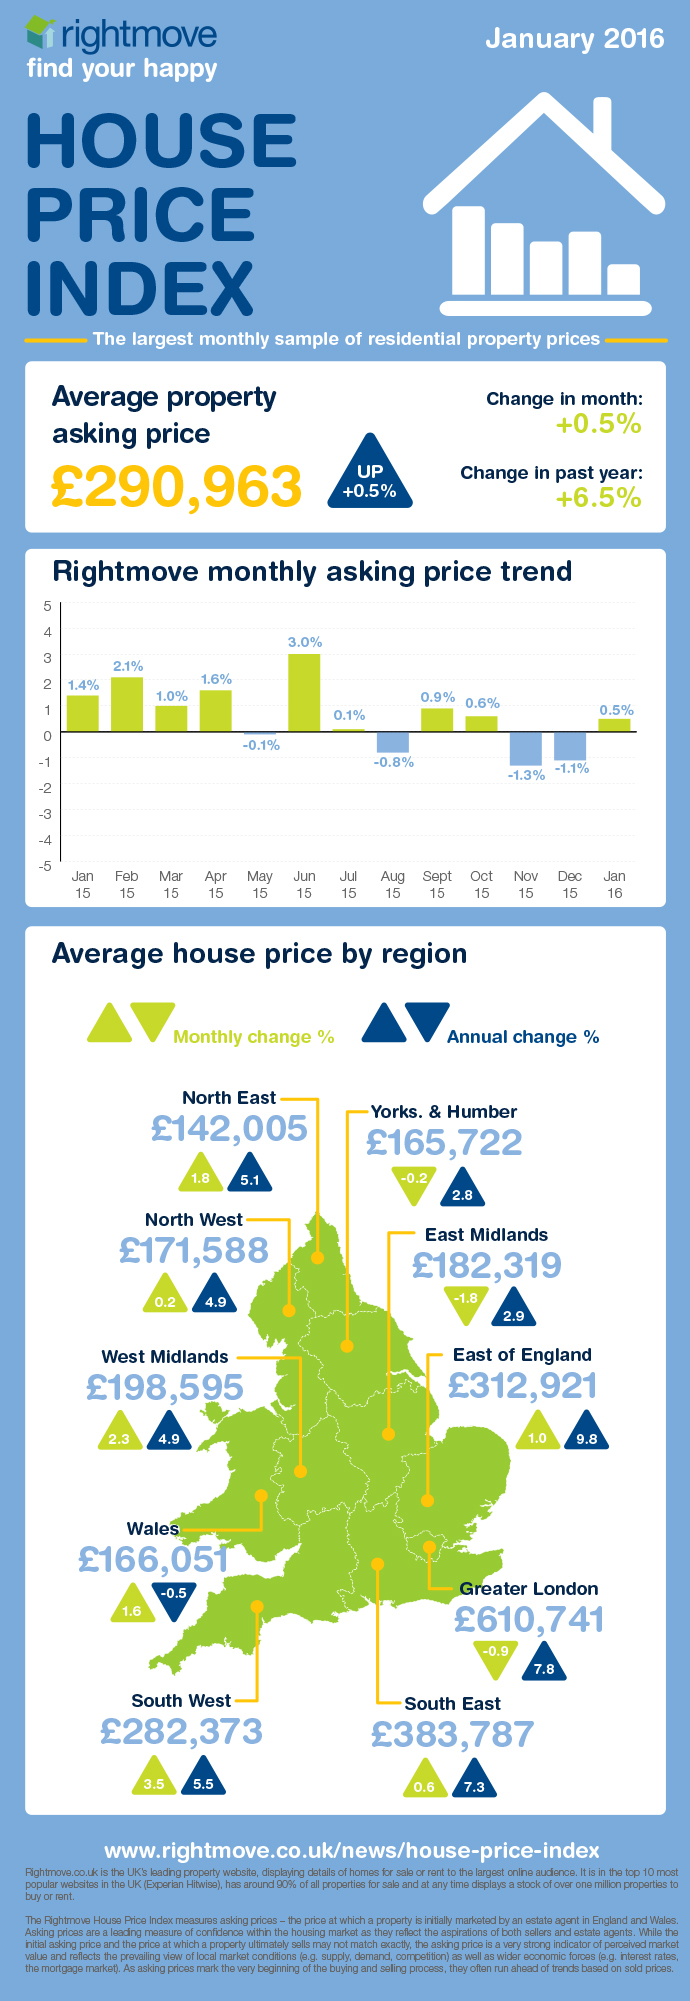
January 2016 property trends infographic

HPI

Rightmove’s January House Price Index revealed that the price of property coming to market is up 0.5% (+£1,509), the second highest Christmas/New Year period rise since 2007.

 Our infographic provides a breakdown of how prices are performing across each region and property type.


Infographic


To embed this infographic on your site, copy and paste the following code:

View the full report click here

Read the January House Price Index blog story here


More articles...

Base Rate held at 3.75%: but what could it mean for mortgages?

Base Rate held at 3.75%: but what could it mean for mortgages?

Read more...

Go to article
February is the best time to sell a house – 6 expert tips to get started

February is the best time to sell a house – 6 expert tips to get started

Read more...

Go to article

Copyright © 2000-2026 Rightmove Group Limited. All rights reserved. Rightmove prohibits the scraping of its content. You can find further details here.