
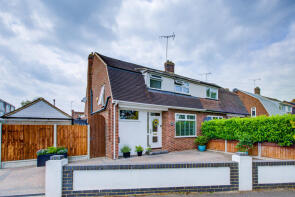
House Prices in Ashingdon
House prices in Ashingdon have an overall average of £405,510 over the last year.
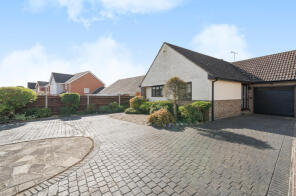
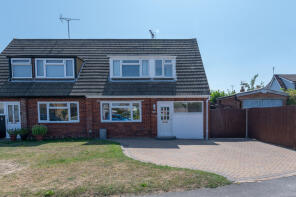
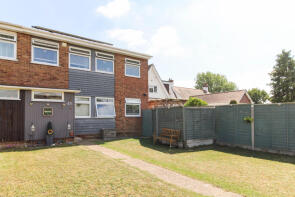
The majority of properties sold in Ashingdon during the last year were semi-detached properties, selling for an average price of £374,156. Detached properties sold for an average of £557,926, with terraced properties fetching £338,900.
Overall, the historical sold prices in Ashingdon over the last year were 2% up on the previous year and 7% up on the 2022 peak of £378,705.
Properties Sold
37, Allerton Close, Rochford SS4 3AR
| Today | See what it's worth now |
| 17 Apr 2026 | £285,000 |
| 27 Mar 1997 | £53,000 |
No other historical records.
436, Ashingdon Road, Rochford SS4 3ET
| Today | See what it's worth now |
| 2 Apr 2026 | £575,000 |
| 9 Jul 2019 | £400,000 |
28, Minton Heights, Ashingdon SS4 3EQ
| Today | See what it's worth now |
| 1 Apr 2026 | £450,000 |
No other historical records.
23, Nutcombe Crescent, Rochford SS4 1RT

| Today | See what it's worth now |
| 27 Mar 2026 | £440,000 |
| 12 May 1998 | £57,500 |
No other historical records.
62, Oxford Road, Rochford SS4 1TE
| Today | See what it's worth now |
| 18 Mar 2026 | £355,000 |
No other historical records.
301, Ashingdon Road, Rochford SS4 1TS
| Today | See what it's worth now |
| 17 Mar 2026 | £375,000 |
| 18 Jan 2006 | £165,000 |
No other historical records.
16, Alexandra Road, Rochford SS4 3HD
| Today | See what it's worth now |
| 17 Mar 2026 | £405,000 |
| 4 Apr 2018 | £280,000 |
No other historical records.
75, Ashcombe, Rochford SS4 1SL
| Today | See what it's worth now |
| 17 Mar 2026 | £515,000 |
| 7 Dec 2018 | £425,000 |
30, The Bramleys, Rochford SS4 3BA

| Today | See what it's worth now |
| 10 Mar 2026 | £355,000 |
| 31 Aug 2007 | £203,000 |
No other historical records.
76c, Rectory Avenue, Ashingdon SS4 3AW
| Today | See what it's worth now |
| 27 Feb 2026 | £168,500 |
No other historical records.
149 Woodham, Rectory Avenue, Rochford SS4 3AW
| Today | See what it's worth now |
| 26 Feb 2026 | £405,000 |
| 22 Dec 2014 | £280,000 |
No other historical records.
4, Newton Hall Gardens, Ashingdon SS4 3ER
| Today | See what it's worth now |
| 25 Feb 2026 | £375,000 |
| 10 Aug 2017 | £281,500 |
No other historical records.
5, Rutland Gardens, Rochford SS4 3AX
| Today | See what it's worth now |
| 16 Feb 2026 | £355,000 |
No other historical records.
45, Cornwall Gardens, Rochford SS4 3AL
| Today | See what it's worth now |
| 12 Feb 2026 | £360,000 |
| 22 Sep 2017 | £292,000 |
2, Highcliff Crescent, Rochford SS4 3HN
| Today | See what it's worth now |
| 12 Feb 2026 | £442,000 |
| 17 Jan 2018 | £284,000 |
15, Princess Gardens, Rochford SS4 3BL
| Today | See what it's worth now |
| 9 Feb 2026 | £355,000 |
| 22 Jul 2019 | £295,000 |
No other historical records.
27, Brays Lane, Rochford SS4 3DP
| Today | See what it's worth now |
| 9 Feb 2026 | £620,000 |
| 21 Nov 2003 | £340,000 |
39, Allerton Close, Rochford SS4 3AR
| Today | See what it's worth now |
| 6 Feb 2026 | £325,000 |
| 16 Jun 2021 | £275,000 |
20, Silverthorn Close, Rochford SS4 1SG
| Today | See what it's worth now |
| 6 Feb 2026 | £372,000 |
| 16 Jan 2008 | £245,000 |
40, Princess Gardens, Rochford SS4 3BL
| Today | See what it's worth now |
| 6 Feb 2026 | £340,000 |
| 4 Feb 2000 | £94,000 |
277a, Ashingdon Road, Rochford SS4 1UA
| Today | See what it's worth now |
| 2 Feb 2026 | £225,000 |
| 3 Feb 2023 | £225,000 |
Rosebud, The Chase, Ashingdon SS4 3JE
| Today | See what it's worth now |
| 30 Jan 2026 | £1,050,000 |
No other historical records.
92, Lesney Gardens, Rochford SS4 1TZ
| Today | See what it's worth now |
| 30 Jan 2026 | £165,000 |
| 1 Nov 2019 | £135,000 |
Source Acknowledgement: © Crown copyright. England and Wales house price data is publicly available information produced by the HM Land Registry.This material was last updated on 9 July 2026. It covers the period from 1 January 1995 to 30 April 2026 and contains property transactions which have been registered during that period. Contains HM Land Registry data © Crown copyright and database right 2026. This data is licensed under the Open Government Licence v3.0.
Disclaimer: Rightmove.co.uk provides this HM Land Registry data "as is". The burden for fitness of the data relies completely with the user and is provided for informational purposes only. No warranty, express or implied, is given relating to the accuracy of content of the HM Land Registry data and Rightmove does not accept any liability for error or omission. If you have found an error with the data or need further information please contact HM Land Registry.
Permitted Use: Viewers of this Information are granted permission to access this Crown copyright material and to download it onto electronic, magnetic, optical or similar storage media provided that such activities are for private research, study or in-house use only. Any other use of the material requires the formal written permission of Land Registry which can be requested from us, and is subject to an additional licence and associated charge.
Rightmove takes no liability for your use of, or reliance on, Rightmove's Instant Valuation due to the limitations of our tracking tool listed here. Use of this tool is taken entirely at your own risk. All rights reserved.