
House Prices in B16
House prices in B16 have an overall average of £273,024 over the last year.
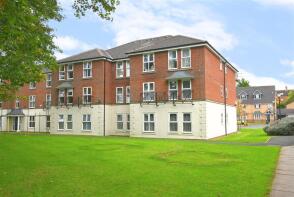
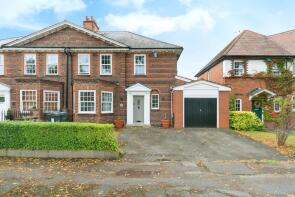
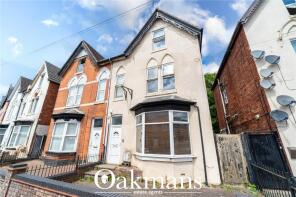
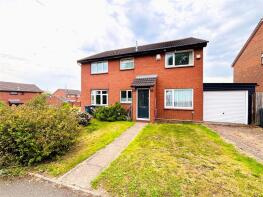
The majority of properties sold in B16 during the last year were flats, selling for an average price of £175,045. Terraced properties sold for an average of £301,540, with semi-detached properties fetching £391,175.
Overall, the historical sold prices in B16 over the last year were 5% down on the previous year and similar to the 2023 peak of £271,439.
Properties Sold
219, City Road, Soho, Birmingham B16 0PU

| Today | See what it's worth now |
| 16 Apr 2026 | £331,000 |
| 30 Jun 2009 | £186,000 |
No other historical records.
37, 29 Mountbatten House, Wyndham Road, Birmingham B16 9RJ
| Today | See what it's worth now |
| 14 Apr 2026 | £85,000 |
| 6 Apr 2005 | £75,000 |
9, Vernon Road, Birmingham B16 9SQ
| Today | See what it's worth now |
| 7 Apr 2026 | £712,000 |
| 21 Oct 2015 | £650,000 |
No other historical records.
Extensions and planning permission in B16
See planning approval stats, extension build costs and value added estimates.

Flat 5, 26, Francis Road, Ladywood, Birmingham B16 8SN
| Today | See what it's worth now |
| 31 Mar 2026 | £92,500 |
No other historical records.
28, Stanmore Road, Harborne, Birmingham B16 9TA
| Today | See what it's worth now |
| 31 Mar 2026 | £525,000 |
| 26 Apr 2013 | £244,000 |
No other historical records.
34a, Vernon Road, Birmingham B16 9SH

| Today | See what it's worth now |
| 27 Mar 2026 | £530,000 |
No other historical records.
17, Melville Hall, Holly Road, Edgbaston, Birmingham B16 9NJ
| Today | See what it's worth now |
| 27 Mar 2026 | £47,218 |
| 11 Mar 2024 | £195,000 |
24, St Lawrence House, Melville Road, Birmingham B16 9NQ
| Today | See what it's worth now |
| 27 Mar 2026 | £125,000 |
No other historical records.
B7, Kenilworth Court, Hagley Road, Edgbaston, Birmingham B16 9NS
| Today | See what it's worth now |
| 24 Mar 2026 | £295,000 |
| 18 Mar 2019 | £235,000 |
12, 2 Victoria House, Manor Road, Edgbaston, Birmingham B16 9ND
| Today | See what it's worth now |
| 23 Mar 2026 | £122,500 |
| 22 Dec 2003 | £115,000 |
No other historical records.
37, Selwyn Road, Ladywood, Birmingham B16 0SJ
| Today | See what it's worth now |
| 19 Mar 2026 | £640,000 |
| 29 Jul 2015 | £375,000 |
No other historical records.
Flat 28, 20, Sheepcote Street, Birmingham B16 8AE
| Today | See what it's worth now |
| 6 Mar 2026 | £110,000 |
| 10 Jan 2013 | £92,500 |
3, The Grove, Ladywood, Birmingham B16 9EB
| Today | See what it's worth now |
| 5 Mar 2026 | £232,000 |
| 31 Jan 1996 | £31,000 |
No other historical records.
12, Wicket Drive, Birmingham B16 0ND
| Today | See what it's worth now |
| 4 Mar 2026 | £355,000 |
| 23 Jun 2017 | £262,995 |
No other historical records.
40, South Loop Park, Birmingham B16 0AF

| Today | See what it's worth now |
| 4 Mar 2026 | £342,000 |
| 9 Oct 2019 | £289,000 |
No other historical records.
Flat 7, 50, Mariner Avenue, Birmingham B16 9DT
| Today | See what it's worth now |
| 3 Mar 2026 | £80,000 |
| 14 Oct 2005 | £106,500 |
No other historical records.
1 The Coach House, Montague Road, Edgbaston, Birmingham B16 9HR
| Today | See what it's worth now |
| 2 Mar 2026 | £355,000 |
| 9 Apr 2018 | £370,000 |
10, Grosvenor Street West, Birmingham B16 8HN

| Today | See what it's worth now |
| 27 Feb 2026 | £185,000 |
No other historical records.
114, Stanmore Road, Soho, Birmingham B16 0SX
| Today | See what it's worth now |
| 24 Feb 2026 | £460,000 |
| 23 Mar 2018 | £337,000 |
60, Summerfield Crescent, Birmingham B16 0ER
| Today | See what it's worth now |
| 20 Feb 2026 | £370,000 |
| 24 Mar 2016 | £320,000 |
40, Osler Street, Birmingham B16 9EU
| Today | See what it's worth now |
| 18 Feb 2026 | £237,500 |
| 7 Aug 2006 | £134,950 |
No other historical records.
69, Duchess Road, Birmingham B16 8JD
| Today | See what it's worth now |
| 13 Feb 2026 | £260,000 |
No other historical records.
50, Stanmore Road, Harborne, Birmingham B16 9TA
| Today | See what it's worth now |
| 12 Feb 2026 | £315,000 |
| 12 Feb 2026 | £315,000 |
No other historical records.
Source Acknowledgement: © Crown copyright. England and Wales house price data is publicly available information produced by the HM Land Registry.This material was last updated on 9 July 2026. It covers the period from 1 January 1995 to 30 April 2026 and contains property transactions which have been registered during that period. Contains HM Land Registry data © Crown copyright and database right 2026. This data is licensed under the Open Government Licence v3.0.
Disclaimer: Rightmove.co.uk provides this HM Land Registry data "as is". The burden for fitness of the data relies completely with the user and is provided for informational purposes only. No warranty, express or implied, is given relating to the accuracy of content of the HM Land Registry data and Rightmove does not accept any liability for error or omission. If you have found an error with the data or need further information please contact HM Land Registry.
Permitted Use: Viewers of this Information are granted permission to access this Crown copyright material and to download it onto electronic, magnetic, optical or similar storage media provided that such activities are for private research, study or in-house use only. Any other use of the material requires the formal written permission of Land Registry which can be requested from us, and is subject to an additional licence and associated charge.
Rightmove takes no liability for your use of, or reliance on, Rightmove's Instant Valuation due to the limitations of our tracking tool listed here. Use of this tool is taken entirely at your own risk. All rights reserved.