
House Prices in BH8
House prices in BH8 have an overall average of £344,587 over the last year.
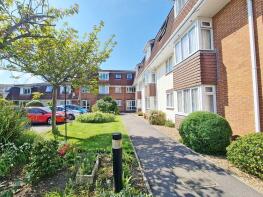
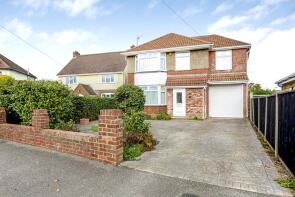
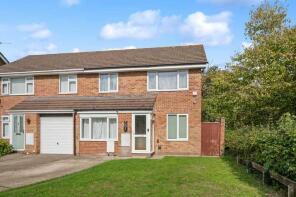
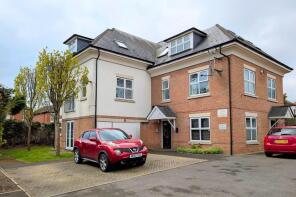
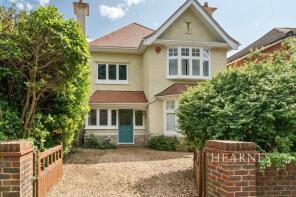
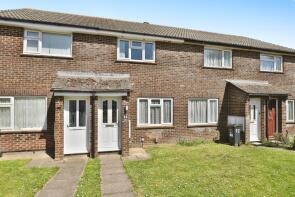
The majority of properties sold in BH8 during the last year were flats, selling for an average price of £185,429. Detached properties sold for an average of £534,055, with semi-detached properties fetching £356,567.
Overall, the historical sold prices in BH8 over the last year were similar to the previous year and 4% up on the 2022 peak of £330,508.
Properties Sold
2, 17a Richmond Heights, Richmond Park Avenue, Bournemouth BH8 9DL
| Today | See what it's worth now |
| 24 Apr 2026 | £228,000 |
| 16 Aug 2013 | £158,500 |
40, Nortoft Road, Bournemouth BH8 8PY
| Today | See what it's worth now |
| 24 Apr 2026 | £370,000 |
| 13 Nov 2002 | £140,000 |
5, Diamond Place, Bournemouth BH8 0FA
| Today | See what it's worth now |
| 24 Apr 2026 | £391,000 |
| 23 Jan 2015 | £278,995 |
No other historical records.
Extensions and planning permission in BH8
See planning approval stats, extension build costs and value added estimates.

Flat 11, Wellington House, Wellington Road, Bournemouth BH8 8JJ

| Today | See what it's worth now |
| 24 Apr 2026 | £200,000 |
| 7 Jul 2023 | £197,500 |
64, Normanhurst Avenue, Bournemouth BH8 9NR
| Today | See what it's worth now |
| 17 Apr 2026 | £580,000 |
| 11 Nov 2022 | £580,000 |
9, Dibden Close, Bournemouth BH8 0EN
| Today | See what it's worth now |
| 9 Apr 2026 | £182,500 |
| 6 Jul 2023 | £165,000 |
36, Stewart Road, Bournemouth BH8 8NU
| Today | See what it's worth now |
| 2 Apr 2026 | £295,000 |
| 31 Aug 2007 | £218,500 |
187a, Holdenhurst Road, Bournemouth BH8 8DG
| Today | See what it's worth now |
| 31 Mar 2026 | £175,000 |
| 26 May 2023 | £175,000 |
6, Dibden Close, Bournemouth BH8 0EN
| Today | See what it's worth now |
| 31 Mar 2026 | £242,500 |
| 26 Aug 2022 | £237,000 |
13, Bramshaw Gardens, Bournemouth BH8 0BT
| Today | See what it's worth now |
| 27 Mar 2026 | £250,000 |
| 20 Mar 2015 | £190,000 |
16, St George's Avenue, Bournemouth BH8 9DF
| Today | See what it's worth now |
| 24 Mar 2026 | £630,000 |
| 5 Dec 2023 | £632,000 |
Flat 1, 39 Aspire, Queens Park Avenue, Bournemouth BH8 9LH

| Today | See what it's worth now |
| 19 Mar 2026 | £200,000 |
| 26 Oct 2021 | £210,000 |
No other historical records.
148a, Holdenhurst Road, Bournemouth BH8 8AS
| Today | See what it's worth now |
| 18 Mar 2026 | £122,000 |
| 17 Apr 2015 | £165,000 |
106, Nortoft Road, Bournemouth BH8 8PZ
| Today | See what it's worth now |
| 13 Mar 2026 | £390,000 |
| 9 Nov 2018 | £330,000 |
140a, Stewart Road, Bournemouth BH8 8NX

| Today | See what it's worth now |
| 13 Mar 2026 | £165,000 |
| 3 Jun 2013 | £121,000 |
49, Normanhurst Avenue, Bournemouth BH8 9NN
| Today | See what it's worth now |
| 13 Mar 2026 | £519,500 |
| 30 Apr 1999 | £112,500 |
No other historical records.
15, Orcheston Road, Bournemouth BH8 8SP
| Today | See what it's worth now |
| 3 Mar 2026 | £390,000 |
| 16 Dec 2009 | £245,000 |
20, Cooper Dean Drive, Bournemouth BH8 9LN
| Today | See what it's worth now |
| 2 Mar 2026 | £295,000 |
| 11 Aug 2009 | £152,500 |
No other historical records.
19, 18 Park View Court, Queens Park West Drive, Bournemouth BH8 9DA
| Today | See what it's worth now |
| 27 Feb 2026 | £120,000 |
| 22 Nov 2013 | £112,500 |
26, 101 Sandringham Court, Avon Road, Bournemouth BH8 8SG
| Today | See what it's worth now |
| 27 Feb 2026 | £62,500 |
| 11 Aug 2021 | £87,500 |
9, Culford Close, Bournemouth BH8 0HX
| Today | See what it's worth now |
| 27 Feb 2026 | £555,000 |
No other historical records.
57, Braishfield Gardens, Bournemouth BH8 0QA
| Today | See what it's worth now |
| 27 Feb 2026 | £405,000 |
| 20 Apr 2018 | £298,000 |
2, 86 Queens Park Gate, Richmond Park Road, Bournemouth BH8 8TQ
| Today | See what it's worth now |
| 26 Feb 2026 | £155,000 |
| 30 Sep 2008 | £145,000 |
No other historical records.
Source Acknowledgement: © Crown copyright. England and Wales house price data is publicly available information produced by the HM Land Registry.This material was last updated on 9 July 2026. It covers the period from 1 January 1995 to 30 April 2026 and contains property transactions which have been registered during that period. Contains HM Land Registry data © Crown copyright and database right 2026. This data is licensed under the Open Government Licence v3.0.
Disclaimer: Rightmove.co.uk provides this HM Land Registry data "as is". The burden for fitness of the data relies completely with the user and is provided for informational purposes only. No warranty, express or implied, is given relating to the accuracy of content of the HM Land Registry data and Rightmove does not accept any liability for error or omission. If you have found an error with the data or need further information please contact HM Land Registry.
Permitted Use: Viewers of this Information are granted permission to access this Crown copyright material and to download it onto electronic, magnetic, optical or similar storage media provided that such activities are for private research, study or in-house use only. Any other use of the material requires the formal written permission of Land Registry which can be requested from us, and is subject to an additional licence and associated charge.
Rightmove takes no liability for your use of, or reliance on, Rightmove's Instant Valuation due to the limitations of our tracking tool listed here. Use of this tool is taken entirely at your own risk. All rights reserved.