
House Prices in Barking And Dagenham
House prices in Barking And Dagenham have an overall average of £376,336 over the last year.
The majority of properties sold in Barking And Dagenham during the last year were terraced properties, selling for an average price of £412,169. Flats sold for an average of £232,114, with semi-detached properties fetching £452,153.
Overall, the historical sold prices in Barking And Dagenham over the last year were similar to the previous year and 2% up on the 2023 peak of £369,776.
Properties Sold
107, Gorseway, Rush Green, Romford RM7 0RR
| Today | See today's value |
| 26 Aug 2026 | £610,000 |
| 30 Oct 1998 | £92,500 |
No other historical records.
22, The Clarksons, Boundary Road West, Barking IG11 7JT

| Today | See today's value |
| 25 Aug 2026 | £255,000 |
| 16 May 2008 | £145,000 |
13, Cornshaw Road, Dagenham RM8 1SS
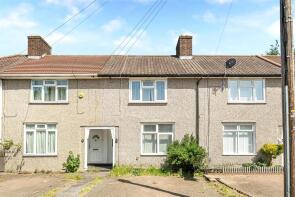
| Today | See today's value |
| 18 Aug 2026 | £405,000 |
| 14 Dec 2016 | £307,000 |
53, Woodshire Road, Dagenham RM10 7DH
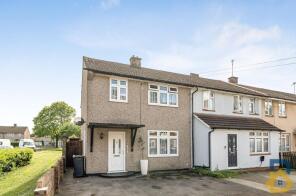
| Today | See today's value |
| 17 Aug 2026 | £422,000 |
No other historical records.
1, Clementhorpe Road, Dagenham RM9 4BJ
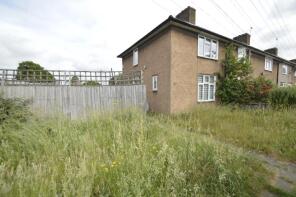
| Today | See today's value |
| 14 Aug 2026 | £360,000 |
No other historical records.
120, Winding Way, Dagenham RM8 2TB
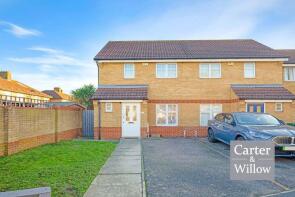
| Today | See today's value |
| 14 Aug 2026 | £400,000 |
| 3 Mar 2017 | £305,000 |
26, Crabtree Avenue, Romford RM6 5EX

| Today | See today's value |
| 14 Aug 2026 | £170,000 |
| 24 Nov 2023 | £210,000 |
41, Valentines Way, Rush Green, Romford RM7 0YD
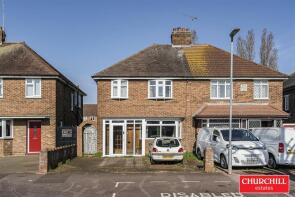
| Today | See today's value |
| 13 Aug 2026 | £445,000 |
No other historical records.
169, Ilchester Road, Dagenham RM8 2YX
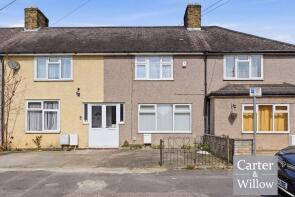
| Today | See today's value |
| 13 Aug 2026 | £370,000 |
No other historical records.
52, Oulton Crescent, Barking IG11 9HF
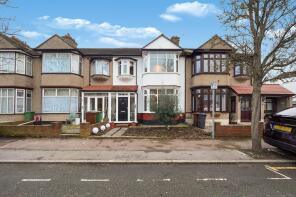
| Today | See today's value |
| 11 Aug 2026 | £525,000 |
| 23 Feb 2018 | £405,000 |
No other historical records.
112, Vincent Road, Dagenham RM9 6AL

| Today | See today's value |
| 11 Aug 2026 | £370,000 |
| 14 Feb 1997 | £46,000 |
No other historical records.
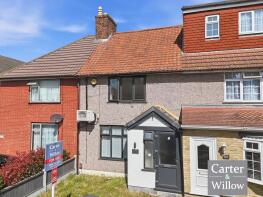
567, Becontree Avenue, Dagenham RM8 3JR
| Today | See today's value |
| 10 Aug 2026 | £395,000 |
| 28 Sep 2018 | £298,000 |
No other historical records.
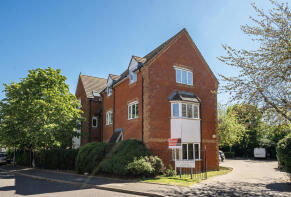
31, Foxglove Road, Rush Green, Romford RM7 0YW
| Today | See today's value |
| 10 Aug 2026 | £242,000 |
| 5 Apr 2007 | £160,000 |
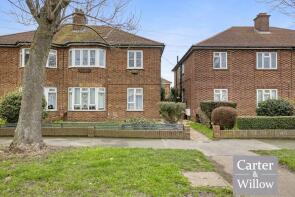
400, Rainham Road South, Dagenham RM10 7XA
| Today | See today's value |
| 7 Aug 2026 | £292,500 |
No other historical records.
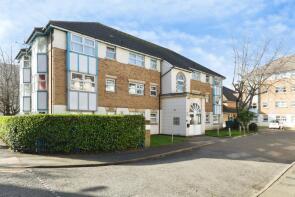
7, Cuthberga Close, Barking IG11 8BS
| Today | See today's value |
| 7 Aug 2026 | £230,000 |
| 21 Aug 1998 | £66,250 |
No other historical records.
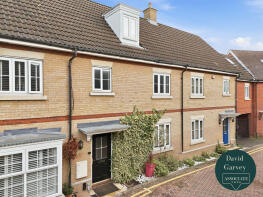
44, Lockwell Road, Dagenham RM10 7RE
| Today | See today's value |
| 7 Aug 2026 | £450,000 |
| 22 Jan 2016 | £300,000 |
27, Cowbridge Lane, Barking IG11 8LQ

| Today | See today's value |
| 7 Aug 2026 | £420,000 |
| 19 Oct 2010 | £162,500 |
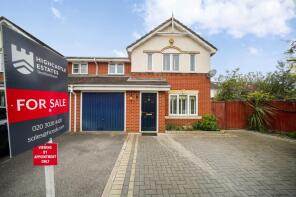
2, Payne Close, Barking IG11 9PL
| Today | See today's value |
| 7 Aug 2026 | £585,000 |
No other historical records.
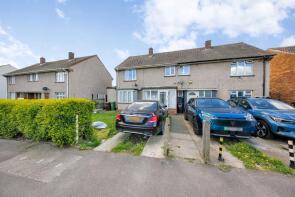
231, Rose Lane, Romford RM6 5NH
| Today | See today's value |
| 7 Aug 2026 | £420,000 |
| 19 Jan 2007 | £220,000 |
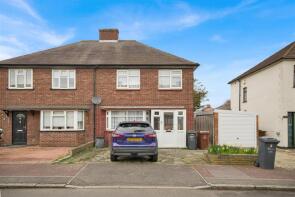
63, Stanley Avenue, Dagenham RM8 1JL
| Today | See today's value |
| 6 Aug 2026 | £410,000 |
No other historical records.
26, Hardie Road, Dagenham RM10 7BS
| Today | See today's value |
| 5 Aug 2026 | £510,000 |
No other historical records.
79, Cecil Road, Romford RM6 6LB

| Today | See today's value |
| 5 Aug 2026 | £475,000 |
| 23 Jun 1998 | £77,500 |
No other historical records.
47, Hatfield Road, Dagenham RM9 6JR
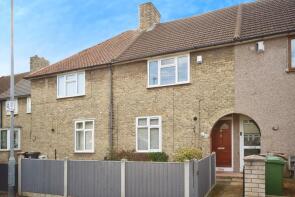
| Today | See today's value |
| 3 Aug 2026 | £375,000 |
No other historical records.
Rightmove takes no liability for your use of, or reliance on, Rightmove's Instant Valuation due to the limitations of our tracking tool listed here. Use of this tool is taken entirely at your own risk. All rights reserved.