
House Prices in Hornchurch
House prices in Hornchurch have an overall average of £492,871 over the last year.
The majority of properties sold in Hornchurch during the last year were semi-detached properties, selling for an average price of £532,686. Terraced properties sold for an average of £461,411, with flats fetching £275,926.
Overall, the historical sold prices in Hornchurch over the last year were 3% down on the previous year and similar to the 2022 peak of £497,115.
Properties Sold
198, Lancaster Drive, Hornchurch RM12 5SJ
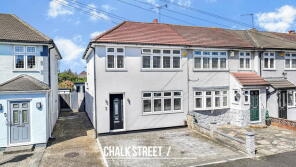
| Today | See today's value |
| 20 Aug 2026 | £528,000 |
| 30 Sep 2019 | £367,500 |
13, Albany Road, Hornchurch RM12 4AE
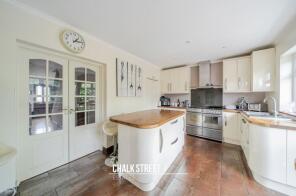
| Today | See today's value |
| 20 Aug 2026 | £585,000 |
| 3 Mar 1997 | £81,000 |
No other historical records.
12, Moore House, Globe Road, Hornchurch RM11 1BW
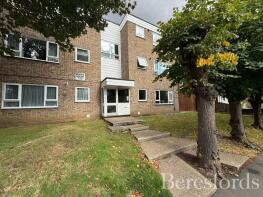
| Today | See today's value |
| 19 Aug 2026 | £257,500 |
| 20 Dec 2007 | £166,000 |
59, Ardleigh Green Road, Hornchurch RM11 2JZ
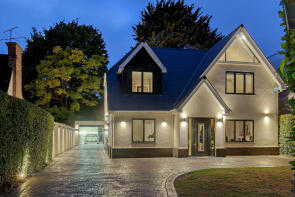
| Today | See today's value |
| 19 Aug 2026 | £1,540,000 |
| 1 Feb 2016 | £525,000 |
No other historical records.
8, Nelmes Way, Hornchurch RM11 2QZ
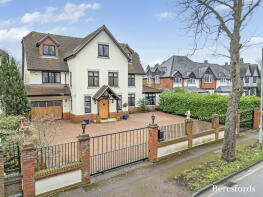
| Today | See today's value |
| 19 Aug 2026 | £1,750,000 |
No other historical records.
151, Warren Drive, Hornchurch RM12 4QU
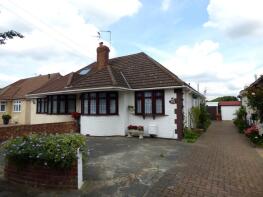
| Today | See today's value |
| 18 Aug 2026 | £442,500 |
| 9 Oct 2017 | £425,000 |
No other historical records.
9, Goldsmere Court, Fentiman Way, Hornchurch RM11 3XY
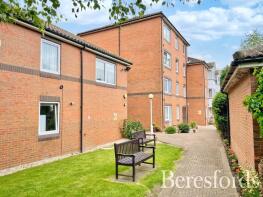
| Today | See today's value |
| 17 Aug 2026 | £240,000 |
| 22 Oct 2021 | £245,000 |
No other historical records.
6, The Limes, Hornchurch RM11 2GT
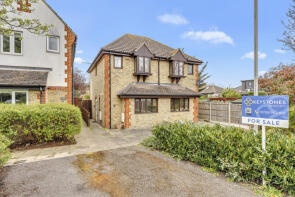
| Today | See today's value |
| 14 Aug 2026 | £395,000 |
| 28 Jan 2008 | £222,500 |
51, Hyland Close, Hornchurch RM11 1DX
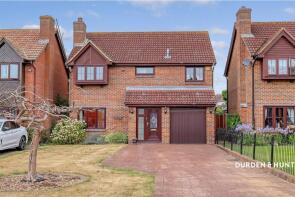
| Today | See today's value |
| 14 Aug 2026 | £677,500 |
| 24 May 2007 | £425,000 |
No other historical records.
42, Sarre Avenue, Hornchurch RM12 6TP
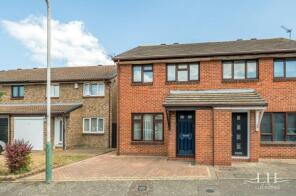
| Today | See today's value |
| 13 Aug 2026 | £415,000 |
| 28 Jun 2001 | £125,000 |
No other historical records.
Apartment 7, Stone House, Suttons Lane, Hornchurch RM12 6SH
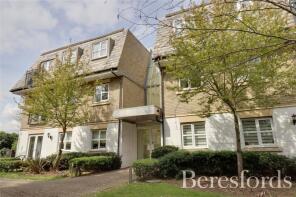
| Today | See today's value |
| 12 Aug 2026 | £275,000 |
| 8 Sep 2006 | £185,000 |
No other historical records.
102, Park Lane, Hornchurch RM11 1BE
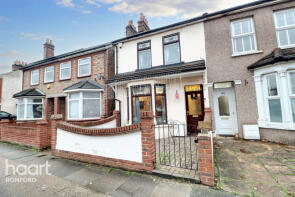
| Today | See today's value |
| 10 Aug 2026 | £410,000 |
| 14 Jan 2011 | £235,000 |
328, Abbs Cross Lane, Hornchurch RM12 4YD
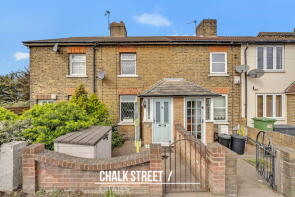
| Today | See today's value |
| 7 Aug 2026 | £360,000 |
| 19 Nov 2021 | £347,500 |
6, North Block The Railstore, Kidman Close, Gidea Park, Romford RM2 6JN
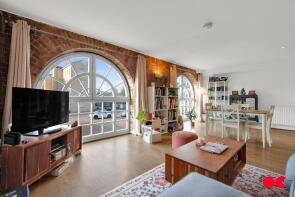
| Today | See today's value |
| 7 Aug 2026 | £360,000 |
| 30 Oct 2023 | £330,000 |
17, Osborne Road, Hornchurch RM11 1EX
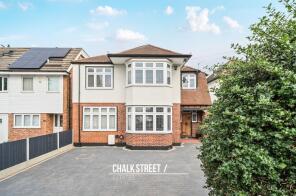
| Today | See today's value |
| 7 Aug 2026 | £895,000 |
| 30 Jul 1999 | £229,000 |
No other historical records.
14, Chestnut Avenue, Hornchurch RM12 4HW
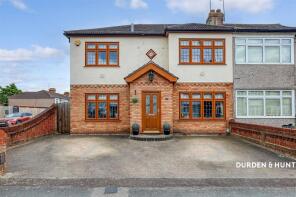
| Today | See today's value |
| 7 Aug 2026 | £680,000 |
| 20 Feb 2002 | £280,000 |
No other historical records.
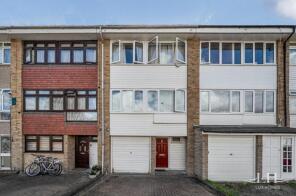
7, Yale Way, Hornchurch RM12 4BD
| Today | See today's value |
| 7 Aug 2026 | £465,000 |
| 23 Apr 2021 | £350,000 |
No other historical records.
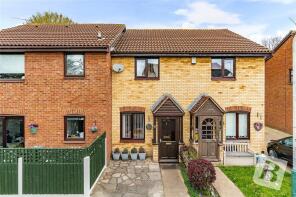
37, Mansard Close, Hornchurch RM12 4HS
| Today | See today's value |
| 6 Aug 2026 | £350,000 |
| 20 May 2002 | £130,000 |
34, Hornminster Glen, Hornchurch RM11 3XL

| Today | See today's value |
| 5 Aug 2026 | £520,000 |
| 9 Jun 2005 | £222,800 |
No other historical records.
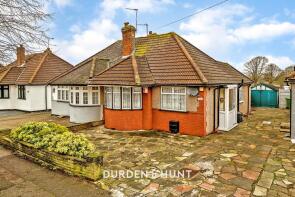
159, Warren Drive, Hornchurch RM12 4QU
| Today | See today's value |
| 4 Aug 2026 | £435,000 |
No other historical records.
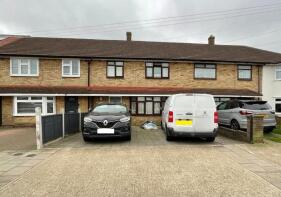
63, Mungo Park Road, Rainham RM13 7PJ
| Today | See today's value |
| 3 Aug 2026 | £406,500 |
| 14 Nov 2017 | £287,000 |
No other historical records.
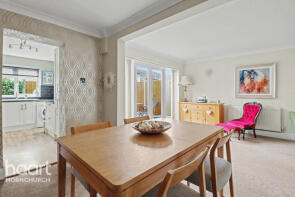
80, Tangmere Crescent, Hornchurch RM12 5PX
| Today | See today's value |
| 3 Aug 2026 | £445,000 |
| 14 Oct 2010 | £237,995 |
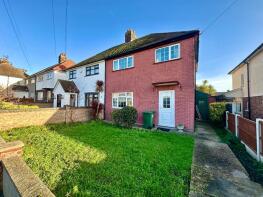
83, Plumpton Avenue, Hornchurch RM12 6BB
| Today | See today's value |
| 31 Jul 2026 | £462,000 |
No other historical records.
Rightmove takes no liability for your use of, or reliance on, Rightmove's Instant Valuation due to the limitations of our tracking tool listed here. Use of this tool is taken entirely at your own risk. All rights reserved.