
House Prices in Barry Island
House prices in Barry Island have an overall average of £270,959 over the last year.
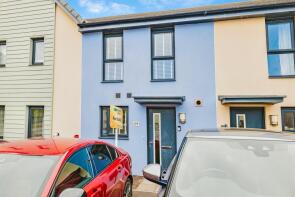
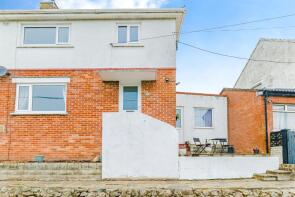
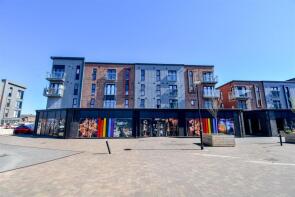
The majority of properties sold in Barry Island during the last year were terraced properties, selling for an average price of £283,891. Flats sold for an average of £145,864, with semi-detached properties fetching £282,000.
Overall, the historical sold prices in Barry Island over the last year were 5% up on the previous year and 13% up on the 2023 peak of £239,695.
Properties Sold
176, Phyllis Street, Barry CF62 5UU
| Today | See what it's worth now |
| 24 Apr 2026 | £257,500 |
| 7 Nov 2006 | £124,950 |
23, Gwalch Y Penwaig, Barry CF62 5AG
| Today | See what it's worth now |
| 21 Apr 2026 | £335,000 |
| 30 Apr 2015 | £221,000 |
83, Clive Road, Barry CF62 5UZ
| Today | See what it's worth now |
| 10 Apr 2026 | £230,000 |
| 22 Nov 2024 | £130,000 |
No other historical records.
3, Adar Y Mor, Barry CF62 5AF

| Today | See what it's worth now |
| 1 Apr 2026 | £285,000 |
| 16 Jan 2018 | £197,000 |
46, Heol Ty Draw, Barry CF62 5DU

| Today | See what it's worth now |
| 27 Mar 2026 | £315,000 |
| 19 Feb 2021 | £240,000 |
No other historical records.
10, Ffordd Y Mileniwm, Barry CF62 5AT
| Today | See what it's worth now |
| 27 Mar 2026 | £265,000 |
| 9 Jun 2017 | £189,000 |
No other historical records.
8, Plymouth Road, Barry CF62 5TY
| Today | See what it's worth now |
| 27 Mar 2026 | £405,000 |
| 6 Dec 2013 | £143,000 |
No other historical records.
15, Harbour Walk, Barry CF62 5BA

| Today | See what it's worth now |
| 27 Mar 2026 | £260,000 |
| 30 Aug 2019 | £185,000 |
33, Phyllis Street, Barry CF62 5UX
| Today | See what it's worth now |
| 26 Mar 2026 | £200,000 |
| 28 Mar 2014 | £98,000 |
No other historical records.
42, Portland Drive, Barry CF62 5AU
| Today | See what it's worth now |
| 25 Mar 2026 | £310,000 |
| 26 Jun 2015 | £236,995 |
No other historical records.
70, Ffordd Pentre, Barry CF62 5DP
| Today | See what it's worth now |
| 16 Mar 2026 | £304,000 |
| 17 Dec 2020 | £266,995 |
No other historical records.
12, Heol Penygraig, Barry CF62 5DQ
| Today | See what it's worth now |
| 13 Mar 2026 | £275,000 |
| 18 Jun 2021 | £248,500 |
No other historical records.
28, Baruc Way, Barry CF62 5AX
| Today | See what it's worth now |
| 2 Mar 2026 | £375,000 |
| 30 Sep 2016 | £220,995 |
No other historical records.
16, Island View, Barry CF62 5BB
| Today | See what it's worth now |
| 27 Feb 2026 | £330,000 |
| 24 Jun 2016 | £200,000 |
No other historical records.
3, Rhodfa Sweldon, Barry CF62 5AD
| Today | See what it's worth now |
| 27 Feb 2026 | £295,000 |
| 2 Mar 2020 | £222,500 |
11, Heol Ty Draw, Barry CF62 5DT
| Today | See what it's worth now |
| 27 Feb 2026 | £290,000 |
| 23 Oct 2020 | £227,995 |
No other historical records.
23, Clos Yr Wylan, Barry CF62 5DB
| Today | See what it's worth now |
| 27 Feb 2026 | £599,950 |
| 26 Mar 2004 | £247,369 |
No other historical records.
25, Plymouth Road, Barry CF62 5TY
| Today | See what it's worth now |
| 26 Feb 2026 | £327,000 |
| 17 Oct 1996 | £45,000 |
11, Haven Walk, Barry CF62 5AZ
| Today | See what it's worth now |
| 18 Feb 2026 | £320,000 |
| 31 Jan 2018 | £208,000 |
26, Rhodfa Cambo, Barry CF62 5BS
| Today | See what it's worth now |
| 16 Feb 2026 | £240,000 |
| 20 Sep 2019 | £189,995 |
No other historical records.
52, Plymouth Road, Barry CF62 5TZ
| Today | See what it's worth now |
| 16 Feb 2026 | £242,000 |
| 29 Jan 2021 | £142,500 |
No other historical records.
27, Portland Drive, Barry CF62 5AU
| Today | See what it's worth now |
| 13 Feb 2026 | £260,000 |
| 4 Jul 2016 | £122,500 |
No other historical records.
50, Neptune Road, Barry CF62 5BR
| Today | See what it's worth now |
| 5 Jan 2026 | £151,000 |
| 29 Apr 2024 | £148,000 |

Source Acknowledgement: © Crown copyright. England and Wales house price data is publicly available information produced by the HM Land Registry.This material was last updated on 9 July 2026. It covers the period from 1 January 1995 to 30 April 2026 and contains property transactions which have been registered during that period. Contains HM Land Registry data © Crown copyright and database right 2026. This data is licensed under the Open Government Licence v3.0.
Disclaimer: Rightmove.co.uk provides this HM Land Registry data "as is". The burden for fitness of the data relies completely with the user and is provided for informational purposes only. No warranty, express or implied, is given relating to the accuracy of content of the HM Land Registry data and Rightmove does not accept any liability for error or omission. If you have found an error with the data or need further information please contact HM Land Registry.
Permitted Use: Viewers of this Information are granted permission to access this Crown copyright material and to download it onto electronic, magnetic, optical or similar storage media provided that such activities are for private research, study or in-house use only. Any other use of the material requires the formal written permission of Land Registry which can be requested from us, and is subject to an additional licence and associated charge.
Rightmove takes no liability for your use of, or reliance on, Rightmove's Instant Valuation due to the limitations of our tracking tool listed here. Use of this tool is taken entirely at your own risk. All rights reserved.