
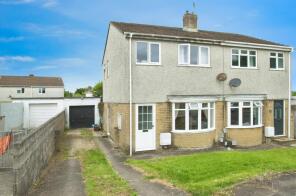
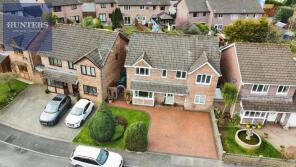
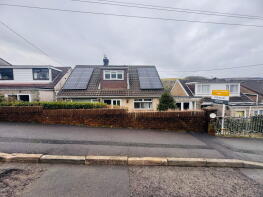
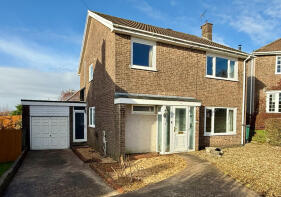
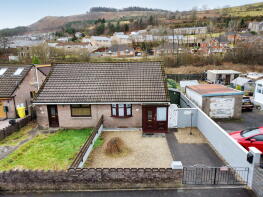
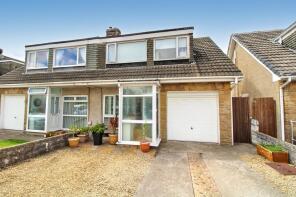
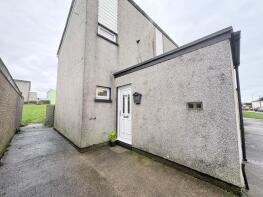
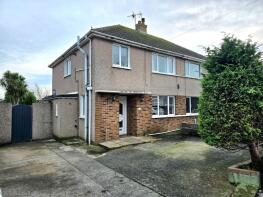
House Prices in Bridgend (County of)
House prices in Bridgend (County of) have an overall average of £244,060 over the last year.
The majority of properties sold in Bridgend (County of) during the last year were semi-detached properties, selling for an average price of £231,230. Terraced properties sold for an average of £165,929, with detached properties fetching £357,026.
Overall, the historical sold prices in Bridgend (County of) over the last year were 4% up on the previous year and 8% up on the 2023 peak of £225,104.
Properties Sold
23, Springfield Gardens, Bridgend CF31 1NP
| Today | See what it's worth now |
| 24 Apr 2026 | £151,000 |
| 31 Aug 2011 | £89,000 |
No other historical records.
132, Ffordd Y Draen, Coity, Bridgend CF35 6DQ

| Today | See what it's worth now |
| 24 Apr 2026 | £450,000 |
| 28 Oct 2013 | £300,000 |
No other historical records.
103, Clos Yr Eryr, Coity, Bridgend CF35 6HF
| Today | See what it's worth now |
| 24 Apr 2026 | £316,000 |
| 6 May 2016 | £215,000 |
No other historical records.
1, Phyllis Avenue, Bridgend CF31 3DD
| Today | See what it's worth now |
| 24 Apr 2026 | £185,000 |
| 24 May 2021 | £150,000 |
74, Fulmar Road, Nottage, Porthcawl CF36 3PW
| Today | See what it's worth now |
| 23 Apr 2026 | £370,000 |
| 10 Jun 2019 | £270,000 |
No other historical records.
24, Derwen View, Brackla, Bridgend CF31 2QU
| Today | See what it's worth now |
| 21 Apr 2026 | £260,000 |
| 30 Jun 2003 | £120,000 |
No other historical records.
2, Dunraven Cottages, Bridgend CF31 3BE
| Today | See what it's worth now |
| 20 Apr 2026 | £200,000 |
| 22 Mar 2021 | £168,000 |
22, Sarn Hill, Sarn, Bridgend CF32 9RW

| Today | See what it's worth now |
| 20 Apr 2026 | £209,950 |
| 19 Mar 2021 | £125,000 |
No other historical records.
25, West Road, Bridgend CF31 4HD
| Today | See what it's worth now |
| 20 Apr 2026 | £285,000 |
| 24 Jan 2003 | £133,000 |
No other historical records.
70, Fairfield Road, Bridgend CF31 3DS
| Today | See what it's worth now |
| 17 Apr 2026 | £260,000 |
| 2 Jul 1999 | £74,000 |
No other historical records.
54, Hall Drive, North Cornelly, Bridgend CF33 4HR
| Today | See what it's worth now |
| 17 Apr 2026 | £100,000 |
| 14 Oct 2004 | £65,250 |
No other historical records.
36, Georgian Way, Brackla, Bridgend CF31 2EX
| Today | See what it's worth now |
| 17 Apr 2026 | £180,000 |
| 29 Nov 1996 | £44,950 |
No other historical records.
21, Heol Maes-yr-haf, Pencoed, Bridgend CF35 5PJ
| Today | See what it's worth now |
| 17 Apr 2026 | £390,000 |
| 21 Jun 2004 | £179,950 |
No other historical records.
20, Llan Road, Cwmfelin, Maesteg CF34 9HN
| Today | See what it's worth now |
| 17 Apr 2026 | £270,000 |
No other historical records.
9, Anglia Close, Litchard, Bridgend CF31 1QX
| Today | See what it's worth now |
| 14 Apr 2026 | £330,000 |
| 29 Aug 2025 | £325,000 |
No other historical records.
45, Oak Tree Court, Brackla, Bridgend CF31 2BH
| Today | See what it's worth now |
| 14 Apr 2026 | £190,000 |
| 28 Oct 2022 | £175,000 |
7 Penlline Villa, Hawthorn Drive, Coychurch, Bridgend CF35 5ER
| Today | See what it's worth now |
| 14 Apr 2026 | £445,000 |
| 23 Oct 2020 | £209,950 |
11, Jubilee Crescent, Sarn, Bridgend CF32 9SR
| Today | See what it's worth now |
| 14 Apr 2026 | £60,000 |
| 14 Nov 2003 | £48,500 |
No other historical records.
Flat 2, 8 The Granary, St Christophers Court, Coity, Bridgend CF35 6DB
| Today | See what it's worth now |
| 14 Apr 2026 | £187,000 |
| 8 Sep 2023 | £165,000 |
13, Taliesin Close, Pencoed, Bridgend CF35 6JR
| Today | See what it's worth now |
| 10 Apr 2026 | £232,000 |
| 14 Aug 2023 | £215,000 |
43, Hearts Of Oak Cottages, Caerau, Maesteg CF34 0TU
| Today | See what it's worth now |
| 10 Apr 2026 | £150,000 |
| 7 Apr 2017 | £95,000 |
No other historical records.
43, West Park Drive, Nottage, Porthcawl CF36 3RL
| Today | See what it's worth now |
| 10 Apr 2026 | £285,000 |
| 29 Apr 2016 | £186,000 |
2, Heol Bradford, Bettws, Bridgend CF32 8TG
| Today | See what it's worth now |
| 10 Apr 2026 | £140,000 |
| 16 Mar 2007 | £35,000 |
No other historical records.

Source Acknowledgement: © Crown copyright. England and Wales house price data is publicly available information produced by the HM Land Registry.This material was last updated on 9 July 2026. It covers the period from 1 January 1995 to 30 April 2026 and contains property transactions which have been registered during that period. Contains HM Land Registry data © Crown copyright and database right 2026. This data is licensed under the Open Government Licence v3.0.
Disclaimer: Rightmove.co.uk provides this HM Land Registry data "as is". The burden for fitness of the data relies completely with the user and is provided for informational purposes only. No warranty, express or implied, is given relating to the accuracy of content of the HM Land Registry data and Rightmove does not accept any liability for error or omission. If you have found an error with the data or need further information please contact HM Land Registry.
Permitted Use: Viewers of this Information are granted permission to access this Crown copyright material and to download it onto electronic, magnetic, optical or similar storage media provided that such activities are for private research, study or in-house use only. Any other use of the material requires the formal written permission of Land Registry which can be requested from us, and is subject to an additional licence and associated charge.
Rightmove takes no liability for your use of, or reliance on, Rightmove's Instant Valuation due to the limitations of our tracking tool listed here. Use of this tool is taken entirely at your own risk. All rights reserved.