
House Prices in Busheyfield
House prices in Busheyfield have an overall average of £369,954 over the last year.
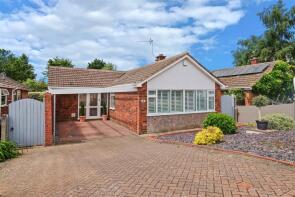
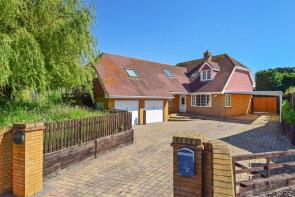
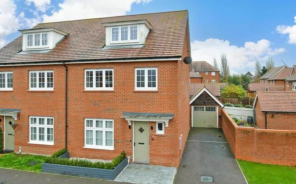
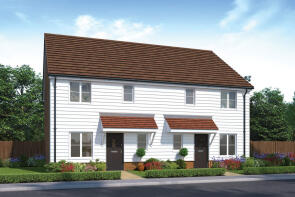
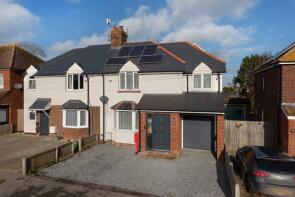
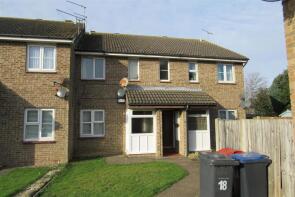
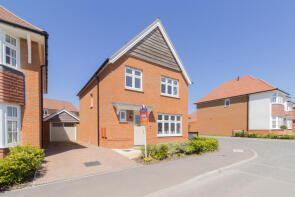
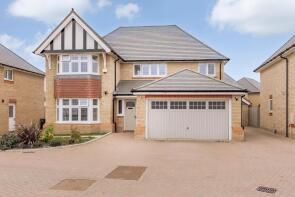
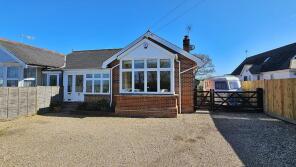
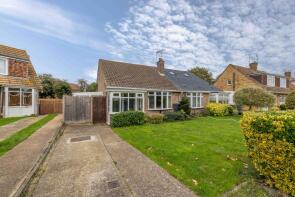
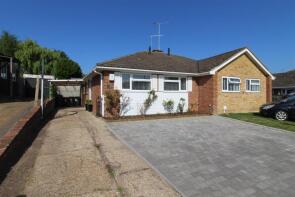
The majority of properties sold in Busheyfield during the last year were detached properties, selling for an average price of £456,728. Semi-detached properties sold for an average of £329,372, with terraced properties fetching £268,543.
Overall, the historical sold prices in Busheyfield over the last year were 4% up on the previous year and 5% down on the 2022 peak of £390,822.
Properties Sold
24, Barley Close, Herne Bay CT6 7XG
| Today | See what it's worth now |
| 15 Dec 2025 | £350,000 |
| 30 Jul 2021 | £310,000 |
13, Brook Close, Herne Bay CT6 7QF
| Today | See what it's worth now |
| 12 Dec 2025 | £278,000 |
| 14 Jul 1995 | £40,000 |
No other historical records.
41, Clare Drive, Herne Bay CT6 7QU
| Today | See what it's worth now |
| 10 Dec 2025 | £280,000 |
| 9 Oct 1995 | £54,500 |
No other historical records.
22, Westlands Road, Herne Bay CT6 7QR
| Today | See what it's worth now |
| 8 Dec 2025 | £323,000 |
| 8 May 1997 | £48,000 |
No other historical records.
4, Streetfield, Herne Bay CT6 7AT
| Today | See what it's worth now |
| 5 Dec 2025 | £377,500 |
| 23 Jun 2023 | £385,000 |
81a Little Orchard, Mill Lane, Herne Bay CT6 7JJ
| Today | See what it's worth now |
| 28 Nov 2025 | £735,000 |
| 20 May 2011 | £415,000 |
No other historical records.
9, Willow Mews, Lower Herne Road, Herne Bay CT6 7PT
| Today | See what it's worth now |
| 28 Nov 2025 | £225,000 |
| 25 Jun 2021 | £207,500 |
13, Bancord Avenue, Herne Bay CT6 5EN
| Today | See what it's worth now |
| 28 Nov 2025 | £395,000 |
| 17 May 2018 | £394,995 |
No other historical records.
192, Greenhill Road, Herne Bay CT6 7RS
| Today | See what it's worth now |
| 27 Nov 2025 | £365,000 |
| 2 May 2002 | £136,000 |
No other historical records.
7, Busheyfields Road, Herne Bay CT6 7LJ


| Today | See what it's worth now |
| 25 Nov 2025 | £750,000 |
| 12 Dec 2016 | £582,500 |
No other historical records.
15, Hunters Forstal Road, Herne Bay CT6 7DN
| Today | See what it's worth now |
| 21 Nov 2025 | £445,000 |
| 8 Jul 2016 | £246,000 |
24, Rye Walk, Herne Bay CT6 7XD
| Today | See what it's worth now |
| 20 Nov 2025 | £89,000 |
| 14 Mar 2003 | £67,500 |
3, Ambrose Avenue, Herne Bay CT6 5SP
| Today | See what it's worth now |
| 14 Nov 2025 | £400,000 |
| 29 Jul 2022 | £434,995 |
No other historical records.
3, Randall Way, Herne Bay CT6 5FS
| Today | See what it's worth now |
| 13 Nov 2025 | £675,000 |
| 29 Jul 2022 | £669,995 |
No other historical records.
2, The Bungalow, Canterbury Road, Herne Common CT6 7JX
| Today | See what it's worth now |
| 3 Nov 2025 | £435,000 |
| 3 Jul 2008 | £260,000 |
No other historical records.
20, Hunters Chase, Herne Bay CT6 7BD
| Today | See what it's worth now |
| 31 Oct 2025 | £320,000 |
| 28 Sep 2021 | £360,000 |
5, Streetfield, Herne Bay CT6 7AT
| Today | See what it's worth now |
| 31 Oct 2025 | £310,000 |
| 29 Nov 2022 | £305,000 |
No other historical records.
57, The Meadows, Herne Bay CT6 7XF
| Today | See what it's worth now |
| 27 Oct 2025 | £270,000 |
| 13 Jul 2001 | £76,000 |
No other historical records.
79, Strode Park Road, Herne Bay CT6 7JQ

| Today | See what it's worth now |
| 27 Oct 2025 | £345,000 |
| 15 Jun 2000 | £89,995 |
No other historical records.
117, Poplar Drive, Herne Bay CT6 7QA
| Today | See what it's worth now |
| 17 Oct 2025 | £250,000 |
| 1 Dec 2006 | £145,000 |
No other historical records.
53, Mill View Road, Herne Bay CT6 7JF
| Today | See what it's worth now |
| 15 Oct 2025 | £315,000 |
| 22 Jul 2015 | £239,995 |
112, Greenhill Road, Herne Bay CT6 7RR
| Today | See what it's worth now |
| 15 Oct 2025 | £287,500 |
No other historical records.
7, The Grange, Brook Close, Herne Bay CT6 7QJ
| Today | See what it's worth now |
| 13 Oct 2025 | £328,000 |
| 17 Apr 2009 | £163,000 |
No other historical records.
8, Woodrow Chase, Herne Bay CT6 7JN
| Today | See what it's worth now |
| 9 Oct 2025 | £280,000 |
| 29 Mar 2019 | £240,000 |
No other historical records.
2, Eastgate Close, Herne Bay CT6 7ER
| Today | See what it's worth now |
| 7 Oct 2025 | £472,000 |
| 21 Jul 2020 | £310,000 |
No other historical records.
Source Acknowledgement: © Crown copyright. England and Wales house price data is publicly available information produced by the HM Land Registry.This material was last updated on 4 February 2026. It covers the period from 1 January 1995 to 24 December 2025 and contains property transactions which have been registered during that period. Contains HM Land Registry data © Crown copyright and database right 2026. This data is licensed under the Open Government Licence v3.0.
Disclaimer: Rightmove.co.uk provides this HM Land Registry data "as is". The burden for fitness of the data relies completely with the user and is provided for informational purposes only. No warranty, express or implied, is given relating to the accuracy of content of the HM Land Registry data and Rightmove does not accept any liability for error or omission. If you have found an error with the data or need further information please contact HM Land Registry.
Permitted Use: Viewers of this Information are granted permission to access this Crown copyright material and to download it onto electronic, magnetic, optical or similar storage media provided that such activities are for private research, study or in-house use only. Any other use of the material requires the formal written permission of Land Registry which can be requested from us, and is subject to an additional licence and associated charge.
Map data ©OpenStreetMap contributors.
Rightmove takes no liability for your use of, or reliance on, Rightmove's Instant Valuation due to the limitations of our tracking tool listed here. Use of this tool is taken entirely at your own risk. All rights reserved.