
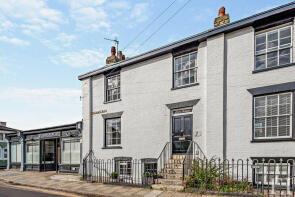
House Prices in CB1
House prices in CB1 have an overall average of £564,332 over the last year.
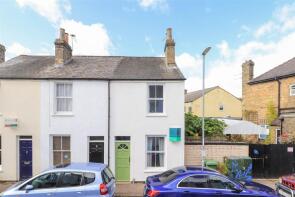
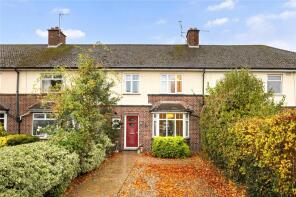
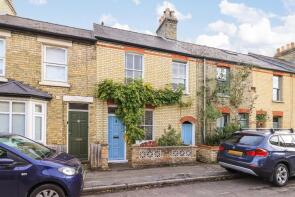
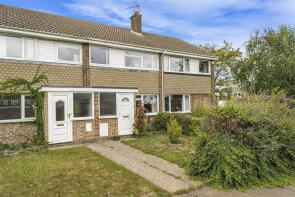
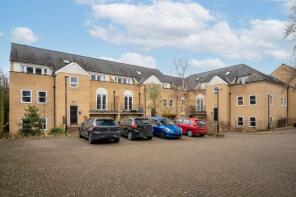
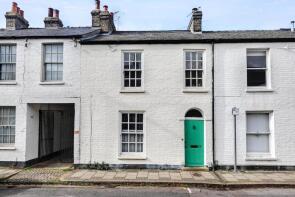
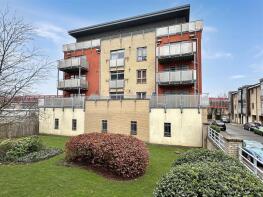
The majority of properties sold in CB1 during the last year were terraced properties, selling for an average price of £560,379. Flats sold for an average of £318,926, with semi-detached properties fetching £677,828.
Overall, the historical sold prices in CB1 over the last year were 3% up on the previous year and 4% up on the 2023 peak of £542,495.
Properties Sold
16, Petersfield Mansions, Petersfield, Cambridge CB1 1BB
| Today | See what it's worth now |
| 27 Apr 2026 | £311,000 |
| 30 Mar 2001 | £121,000 |
10, Windsor Gate, Coldhams Lane, Cambridge CB1 3JH
| Today | See what it's worth now |
| 24 Apr 2026 | £236,000 |
| 31 Aug 2018 | £265,000 |
No other historical records.
26, Wedgewood Drive, Cambridge CB1 9PQ
| Today | See what it's worth now |
| 23 Apr 2026 | £265,000 |
| 5 Apr 2002 | £110,000 |
No other historical records.
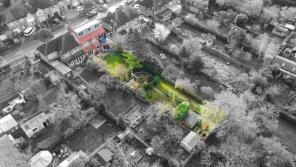
Extensions and planning permission in CB1
See planning approval stats, extension build costs and value added estimates.

23, Jasmine Court, Cherry Hinton Road, Cambridge CB1 8BG
| Today | See what it's worth now |
| 22 Apr 2026 | £227,000 |
| 11 Apr 2022 | £220,000 |
No other historical records.
The Wardens Flat, Millcroft Court, Mill Road, Cambridge CB1 3PE
| Today | See what it's worth now |
| 17 Apr 2026 | £160,000 |
| 9 Apr 2021 | £185,000 |
76, Wycliffe Road, Cambridge CB1 3JE
| Today | See what it's worth now |
| 17 Apr 2026 | £170,000 |
No other historical records.
30, Natal Road, Cambridge CB1 3NS
| Today | See what it's worth now |
| 16 Apr 2026 | £760,000 |
| 29 Jan 2016 | £590,000 |
No other historical records.
6, Windsor Gate, Coldhams Lane, Cambridge CB1 3JH
| Today | See what it's worth now |
| 10 Apr 2026 | £275,000 |
| 28 Sep 2018 | £270,000 |
No other historical records.
26, York Terrace, Cambridge CB1 2PR
| Today | See what it's worth now |
| 7 Apr 2026 | £462,500 |
| 26 Aug 2011 | £280,500 |
10, Tamarin Gardens, Cambridge CB1 9GH
| Today | See what it's worth now |
| 31 Mar 2026 | £584,500 |
| 19 Dec 2014 | £380,000 |
3, Ainsworth Street, Cambridge CB1 2PF
| Today | See what it's worth now |
| 31 Mar 2026 | £430,000 |
| 6 Apr 2004 | £199,950 |
108a, Suez Road, Cambridge CB1 3QD
| Today | See what it's worth now |
| 31 Mar 2026 | £492,500 |
| 30 Mar 2016 | £450,000 |
4, Chalk Grove, Cambridge CB1 8NT
| Today | See what it's worth now |
| 31 Mar 2026 | £930,000 |
| 25 Oct 2013 | £600,000 |
21, Malta Road, Cambridge CB1 3PZ

| Today | See what it's worth now |
| 30 Mar 2026 | £400,000 |
| 26 Sep 1997 | £74,995 |
No other historical records.
34, Holbrook Road, Cambridge CB1 7ST
| Today | See what it's worth now |
| 30 Mar 2026 | £579,000 |
| 18 Jan 2021 | £465,000 |
6, Hemingford Road, Cambridge CB1 3BZ
| Today | See what it's worth now |
| 30 Mar 2026 | £525,000 |
| 17 Aug 2020 | £435,000 |
40, Cowper Road, Cambridge CB1 3SN

| Today | See what it's worth now |
| 30 Mar 2026 | £440,000 |
| 28 Mar 2014 | £410,000 |
1 Fern House, Prospect Row, Cambridge CB1 1DU
| Today | See what it's worth now |
| 30 Mar 2026 | £795,000 |
| 20 Aug 2010 | £417,000 |
140, Mowbray Road, Cambridge CB1 7TG
| Today | See what it's worth now |
| 30 Mar 2026 | £620,000 |
| 1 Feb 2019 | £475,000 |
10, Burnham Close, Cambridge CB1 9XN
| Today | See what it's worth now |
| 27 Mar 2026 | £385,000 |
No other historical records.
2, Pamplin Court, Cambridge CB1 9NB
| Today | See what it's worth now |
| 27 Mar 2026 | £390,000 |
| 27 Jun 2017 | £380,000 |
No other historical records.
60, York Terrace, Cambridge CB1 2PR
| Today | See what it's worth now |
| 27 Mar 2026 | £236,000 |
| 9 Feb 2016 | £235,000 |
No other historical records.
38, City Road, Cambridge CB1 1DP
| Today | See what it's worth now |
| 27 Mar 2026 | £675,000 |
| 4 Apr 2014 | £675,000 |

Source Acknowledgement: © Crown copyright. England and Wales house price data is publicly available information produced by the HM Land Registry.This material was last updated on 9 July 2026. It covers the period from 1 January 1995 to 30 April 2026 and contains property transactions which have been registered during that period. Contains HM Land Registry data © Crown copyright and database right 2026. This data is licensed under the Open Government Licence v3.0.
Disclaimer: Rightmove.co.uk provides this HM Land Registry data "as is". The burden for fitness of the data relies completely with the user and is provided for informational purposes only. No warranty, express or implied, is given relating to the accuracy of content of the HM Land Registry data and Rightmove does not accept any liability for error or omission. If you have found an error with the data or need further information please contact HM Land Registry.
Permitted Use: Viewers of this Information are granted permission to access this Crown copyright material and to download it onto electronic, magnetic, optical or similar storage media provided that such activities are for private research, study or in-house use only. Any other use of the material requires the formal written permission of Land Registry which can be requested from us, and is subject to an additional licence and associated charge.
Rightmove takes no liability for your use of, or reliance on, Rightmove's Instant Valuation due to the limitations of our tracking tool listed here. Use of this tool is taken entirely at your own risk. All rights reserved.