
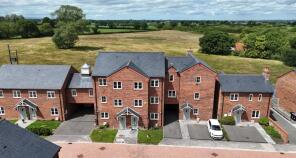
House Prices in CH3
House prices in CH3 have an overall average of £374,032 over the last year.
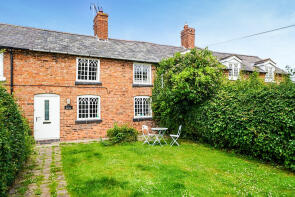
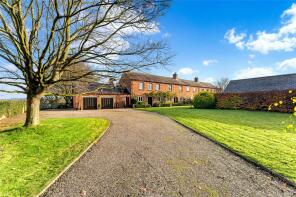
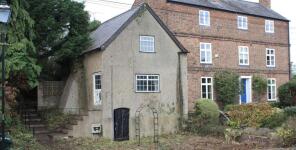
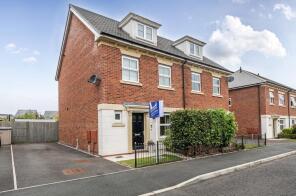
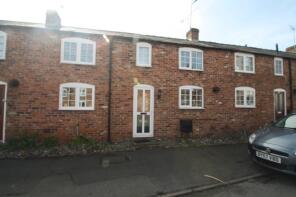
The majority of properties sold in CH3 during the last year were semi-detached properties, selling for an average price of £330,191. Detached properties sold for an average of £505,648, with terraced properties fetching £266,753.
Overall, the historical sold prices in CH3 over the last year were 5% down on the previous year and 1% down on the 2023 peak of £379,372.
Properties Sold
14, Broadmead, Chester CH3 5PT

| Today | See what it's worth now |
| 22 Apr 2026 | £228,000 |
| 16 Oct 2013 | £125,000 |
23, Blackhams Way, Newton By Tattenhall, Chester CH3 9FR
| Today | See what it's worth now |
| 17 Apr 2026 | £442,500 |
| 17 Nov 2023 | £470,000 |
No other historical records.
5, Grosvenor Road, Tarvin, Chester CH3 8EH
| Today | See what it's worth now |
| 14 Apr 2026 | £183,500 |
| 23 Jan 2018 | £260,000 |
Extensions and planning permission in CH3
See planning approval stats, extension build costs and value added estimates.

23, Harrier Way, Farndon, Chester CH3 6RZ

| Today | See what it's worth now |
| 10 Apr 2026 | £310,000 |
| 14 Nov 2019 | £242,995 |
No other historical records.
55, Butterbache Road, Huntington, Chester CH3 6DD
| Today | See what it's worth now |
| 10 Apr 2026 | £380,000 |
| 2 Dec 2016 | £250,000 |
16, Shaftesbury Avenue, Great Boughton, Chester CH3 5LQ
| Today | See what it's worth now |
| 2 Apr 2026 | £420,000 |
| 30 Sep 2013 | £232,950 |
No other historical records.
2, The Limes, Dee Hills Park, Chester CH3 5AS
| Today | See what it's worth now |
| 1 Apr 2026 | £430,000 |
| 2 Jun 2008 | £295,000 |
1, Orchard Grove, Farndon, Chester CH3 6QZ

| Today | See what it's worth now |
| 1 Apr 2026 | £295,000 |
| 24 May 2024 | £280,000 |
12, Brook Side, Great Boughton, Chester CH3 5TL
| Today | See what it's worth now |
| 31 Mar 2026 | £284,000 |
| 21 May 2010 | £156,000 |
3, Mill Lane Cottages, Mill Lane, Barrow, Chester CH3 7JQ

| Today | See what it's worth now |
| 31 Mar 2026 | £300,000 |
| 9 Mar 2018 | £155,000 |
No other historical records.
23, Fox Lane, Waverton, Chester CH3 7PQ
| Today | See what it's worth now |
| 27 Mar 2026 | £374,500 |
| 9 Dec 2021 | £290,000 |
4, Walkers Lane, Farndon, Chester CH3 6QY
| Today | See what it's worth now |
| 27 Mar 2026 | £535,000 |
| 4 Dec 2020 | £305,000 |
No other historical records.
27, Crossfields, Tarvin, Chester CH3 8EW
| Today | See what it's worth now |
| 27 Mar 2026 | £410,000 |
| 28 Jul 2016 | £325,000 |
No other historical records.
77, Highlander Road, Huntington, Chester CH3 6DH
| Today | See what it's worth now |
| 27 Mar 2026 | £462,000 |
| 26 Jun 2015 | £361,995 |
No other historical records.
10, The Holkham, Great Boughton, Chester CH3 5NE
| Today | See what it's worth now |
| 27 Mar 2026 | £510,000 |
| 19 Nov 2015 | £339,000 |
24, Common Lane, Waverton, Chester CH3 7QT
| Today | See what it's worth now |
| 27 Mar 2026 | £695,000 |
| 7 Apr 2006 | £385,000 |
No other historical records.
18, Manor Park, Barrow, Chester CH3 7LH
| Today | See what it's worth now |
| 27 Mar 2026 | £615,000 |
| 19 May 2010 | £315,000 |
No other historical records.
2 Willow Cottage, Crewe Lane South, Farndon, Chester CH3 6PH
| Today | See what it's worth now |
| 26 Mar 2026 | £310,000 |
| 12 Jan 2021 | £215,000 |
No other historical records.
6, Church Mead, Churton By Aldford, Chester CH3 6LP
| Today | See what it's worth now |
| 25 Mar 2026 | £853,500 |
| 3 Dec 2020 | £755,000 |
No other historical records.
Laurel House, High Street, Tarvin, Chester CH3 8JA
| Today | See what it's worth now |
| 25 Mar 2026 | £119,000 |
No other historical records.
6, Heath Close, Great Boughton, Chester CH3 5RZ
| Today | See what it's worth now |
| 24 Mar 2026 | £292,500 |
| 27 May 2021 | £256,500 |
31, Alanbrooke Road, Huntington, Chester CH3 6DN
| Today | See what it's worth now |
| 24 Mar 2026 | £350,000 |
| 22 Jul 2022 | £314,000 |
40, Strawberry Fields, Great Boughton, Chester CH3 5YF

| Today | See what it's worth now |
| 24 Mar 2026 | £360,500 |
| 2 Jan 1997 | £117,950 |
No other historical records.
Source Acknowledgement: © Crown copyright. England and Wales house price data is publicly available information produced by the HM Land Registry.This material was last updated on 9 July 2026. It covers the period from 1 January 1995 to 30 April 2026 and contains property transactions which have been registered during that period. Contains HM Land Registry data © Crown copyright and database right 2026. This data is licensed under the Open Government Licence v3.0.
Disclaimer: Rightmove.co.uk provides this HM Land Registry data "as is". The burden for fitness of the data relies completely with the user and is provided for informational purposes only. No warranty, express or implied, is given relating to the accuracy of content of the HM Land Registry data and Rightmove does not accept any liability for error or omission. If you have found an error with the data or need further information please contact HM Land Registry.
Permitted Use: Viewers of this Information are granted permission to access this Crown copyright material and to download it onto electronic, magnetic, optical or similar storage media provided that such activities are for private research, study or in-house use only. Any other use of the material requires the formal written permission of Land Registry which can be requested from us, and is subject to an additional licence and associated charge.
Rightmove takes no liability for your use of, or reliance on, Rightmove's Instant Valuation due to the limitations of our tracking tool listed here. Use of this tool is taken entirely at your own risk. All rights reserved.