
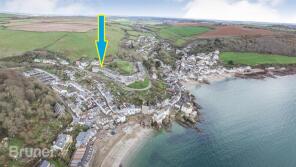
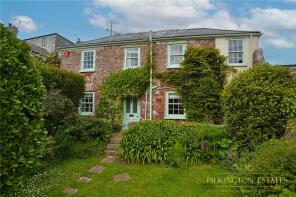
House Prices in Cawsand
House prices in Cawsand have an overall average of £516,000 over the last year.
The majority of properties sold in Cawsand during the last year were terraced properties, selling for an average price of £465,000. Flats sold for an average of £618,000.
Overall, the historical sold prices in Cawsand over the last year were 7% down on the previous year and 2% down on the 2021 peak of £524,604.
Properties Sold
11, The Fort, Torpoint PL10 1PL
| Today | See what it's worth now |
| 12 Nov 2025 | £370,000 |
| 23 Oct 2020 | £300,000 |
1, The Fort, Torpoint PL10 1PL
| Today | See what it's worth now |
| 24 Oct 2025 | £618,000 |
| 15 May 2002 | £330,000 |
No other historical records.
Tamarisk, Fore Street, Torpoint PL10 1NA
| Today | See what it's worth now |
| 12 Sep 2025 | £560,000 |
| 14 Apr 2022 | £565,000 |
10, The Fort, Torpoint PL10 1PL

| Today | See what it's worth now |
| 28 Apr 2025 | £338,500 |
| 19 Mar 2018 | £249,999 |
No other historical records.
Clarendon, Garrett Street, Torpoint PL10 1PD
| Today | See what it's worth now |
| 28 Feb 2025 | £760,000 |
| 12 Nov 2012 | £378,900 |
19, The Fort, Torpoint PL10 1PL
| Today | See what it's worth now |
| 28 Feb 2025 | £360,000 |
| 1 Nov 2001 | £155,000 |
No other historical records.
4, Higher Row, Devonport Hill, Cawsand, Kingsand PL10 1NL
| Today | See what it's worth now |
| 28 Feb 2025 | £300,000 |
No other historical records.
Minnadhu Cottage, Heavitree Road, Kingsand PL10 1NP
| Today | See what it's worth now |
| 21 Feb 2025 | £540,000 |
No other historical records.
6, The Cleave, Torpoint PL10 1NF

| Today | See what it's worth now |
| 7 Feb 2025 | £817,500 |
| 7 Jul 2015 | £515,000 |
38, Coombe Park, Torpoint PL10 1NY
| Today | See what it's worth now |
| 31 Jan 2025 | £300,000 |
| 26 Apr 2004 | £132,000 |
15, St Andrews Street, Torpoint PL10 1PE
| Today | See what it's worth now |
| 29 Jan 2025 | £468,000 |
| 1 May 2013 | £276,750 |
Valletort House, Market Street, Torpoint PL10 1ND

| Today | See what it's worth now |
| 10 Dec 2024 | £450,000 |
| 22 Feb 2005 | £330,000 |
No other historical records.
17, Green Park, Cawsand PL10 1NZ
| Today | See what it's worth now |
| 14 Nov 2024 | £280,000 |
No other historical records.
Upper Balcony, Garrett Street, Torpoint PL10 1PD
| Today | See what it's worth now |
| 29 Oct 2024 | £345,000 |
| 24 Oct 2003 | £162,000 |
Cliff House, Devonport Hill, Torpoint PL10 1NJ
| Today | See what it's worth now |
| 25 Oct 2024 | £1,161,000 |
No other historical records.
Seaspray, Pier Lane, Torpoint PL10 1LP

| Today | See what it's worth now |
| 4 Oct 2024 | £725,000 |
| 17 Oct 2014 | £430,000 |
No other historical records.
Pemberknowse, Garrett Street, Cawsand PL10 1PD
| Today | See what it's worth now |
| 25 Sep 2024 | £450,000 |
No other historical records.
8, Coombe Park Close, Torpoint PL10 1PW

| Today | See what it's worth now |
| 12 Jul 2024 | £680,000 |
| 12 Apr 2019 | £520,000 |
Marina, Garrett Street, Torpoint PL10 1PD

| Today | See what it's worth now |
| 7 Jun 2024 | £950,000 |
| 9 Dec 2005 | £500,000 |
No other historical records.
Strathedene, Fore Street, Torpoint PL10 1NA
| Today | See what it's worth now |
| 28 May 2024 | £570,000 |
| 10 Oct 2018 | £460,000 |
1, Lower Row, Kingsand PL10 1NN

| Today | See what it's worth now |
| 24 May 2024 | £402,500 |
No other historical records.
Endfield, New Road, Torpoint PL10 1PA

| Today | See what it's worth now |
| 21 May 2024 | £489,000 |
| 30 Jun 2009 | £210,000 |
No other historical records.
4, The Bay, The Bound, Torpoint PL10 1PG
| Today | See what it's worth now |
| 8 Apr 2024 | £1,225,000 |
| 9 Apr 2019 | £745,000 |
No other historical records.
Source Acknowledgement: © Crown copyright. England and Wales house price data is publicly available information produced by the HM Land Registry.This material was last updated on 9 July 2026. It covers the period from 1 January 1995 to 30 April 2026 and contains property transactions which have been registered during that period. Contains HM Land Registry data © Crown copyright and database right 2026. This data is licensed under the Open Government Licence v3.0.
Disclaimer: Rightmove.co.uk provides this HM Land Registry data "as is". The burden for fitness of the data relies completely with the user and is provided for informational purposes only. No warranty, express or implied, is given relating to the accuracy of content of the HM Land Registry data and Rightmove does not accept any liability for error or omission. If you have found an error with the data or need further information please contact HM Land Registry.
Permitted Use: Viewers of this Information are granted permission to access this Crown copyright material and to download it onto electronic, magnetic, optical or similar storage media provided that such activities are for private research, study or in-house use only. Any other use of the material requires the formal written permission of Land Registry which can be requested from us, and is subject to an additional licence and associated charge.
Rightmove takes no liability for your use of, or reliance on, Rightmove's Instant Valuation due to the limitations of our tracking tool listed here. Use of this tool is taken entirely at your own risk. All rights reserved.