
House Prices in Chellington
House prices in Chellington have an overall average of £452,000 over the last year.
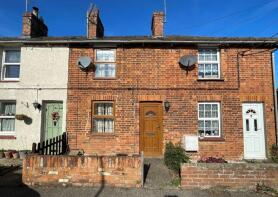
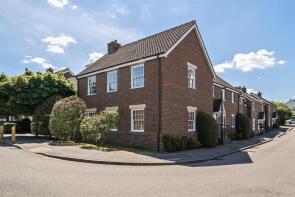
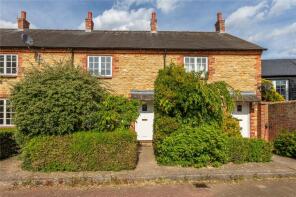
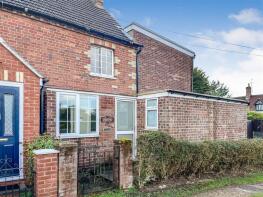
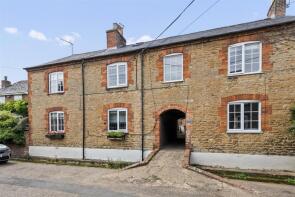
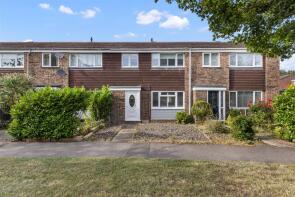
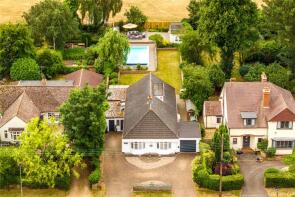
The majority of properties sold in Chellington during the last year were detached properties, selling for an average price of £656,275. Semi-detached properties sold for an average of £368,077, with terraced properties fetching £286,692.
Overall, the historical sold prices in Chellington over the last year were 5% down on the previous year and 5% down on the 2022 peak of £476,107.
Properties Sold
98, Lincroft, Bedford MK43 7SS
| Today | See what it's worth now |
| 26 Mar 2026 | £295,000 |
| 17 Sep 2021 | £291,000 |
No other historical records.
Sherwood, Church Lane, Oakley MK43 7RJ
| Today | See what it's worth now |
| 5 Mar 2026 | £640,000 |
No other historical records.
5, The Green, Bedford MK43 7DB
| Today | See what it's worth now |
| 3 Mar 2026 | £330,000 |
| 14 Jul 2011 | £244,000 |
2, Bevery Close, Oakley MK43 7SH
| Today | See what it's worth now |
| 13 Feb 2026 | £330,000 |
No other historical records.
168, High Street, Bedford MK43 7ED
| Today | See what it's worth now |
| 12 Feb 2026 | £192,000 |
| 28 Sep 2012 | £119,500 |
15, The Furlong, Bedford MK43 7RD
| Today | See what it's worth now |
| 6 Feb 2026 | £205,000 |
| 29 Jul 2016 | £163,000 |
2, Bramley Court, Bedford MK43 7BG
| Today | See what it's worth now |
| 30 Jan 2026 | £215,500 |
| 30 Nov 2022 | £210,000 |
98, Ruffs Furze, Bedford MK43 7RT

| Today | See what it's worth now |
| 23 Jan 2026 | £400,000 |
| 19 Nov 2004 | £285,000 |
4 Liliput, Pavenham Road, Bedford MK43 7HA
| Today | See what it's worth now |
| 9 Jan 2026 | £265,000 |
| 12 Sep 2025 | £235,000 |
13, Brook Lane, Bedford MK43 7BW
| Today | See what it's worth now |
| 18 Dec 2025 | £255,000 |
| 20 Dec 2019 | £179,000 |
11, Hunts Path, Bedford MK43 7SR
| Today | See what it's worth now |
| 11 Dec 2025 | £310,000 |
| 18 Mar 2022 | £295,000 |
9 Oakhaven, High Street, Bedford MK43 7DQ
| Today | See what it's worth now |
| 10 Dec 2025 | £690,000 |
| 20 Jan 2017 | £480,000 |
No other historical records.
25, The Furlong, Bedford MK43 7RD
| Today | See what it's worth now |
| 9 Dec 2025 | £249,500 |
| 28 Mar 2007 | £172,000 |
No other historical records.
11, The Furlong, Bedford MK43 7RD
| Today | See what it's worth now |
| 28 Nov 2025 | £197,500 |
| 1 Nov 2023 | £170,000 |
10 Paddock View, Tannery Lane, Bedford MK43 7AJ
| Today | See what it's worth now |
| 24 Nov 2025 | £1,225,000 |
| 12 Sep 2022 | £1,250,000 |
Farm Cottage, High Street, Bedford MK43 7PE
| Today | See what it's worth now |
| 14 Nov 2025 | £355,000 |
| 26 Sep 1997 | £110,000 |
No other historical records.
7, Saxon House End, Bedford MK43 7FS

| Today | See what it's worth now |
| 13 Nov 2025 | £550,000 |
| 29 Mar 2007 | £365,000 |
No other historical records.
29, Peachs Close, Bedford MK43 7DX
| Today | See what it's worth now |
| 11 Nov 2025 | £108,000 |
| 24 Sep 1997 | £30,000 |
No other historical records.
2, The Marsh, Bedford MK43 7JU

| Today | See what it's worth now |
| 6 Nov 2025 | £500,000 |
| 23 Mar 2007 | £250,000 |
No other historical records.
5, Silver Street, Stevington MK43 7QN
| Today | See what it's worth now |
| 30 Oct 2025 | £190,000 |
No other historical records.
50, High Street, Bedford MK43 7RH
| Today | See what it's worth now |
| 17 Oct 2025 | £305,000 |
| 20 Dec 2018 | £218,000 |
No other historical records.
7, Mowhills, Harrold MK43 7EB
| Today | See what it's worth now |
| 17 Oct 2025 | £315,000 |
No other historical records.
46, The Bury, Pavenham MK43 7PY
| Today | See what it's worth now |
| 16 Oct 2025 | £562,500 |
No other historical records.
Source Acknowledgement: © Crown copyright. England and Wales house price data is publicly available information produced by the HM Land Registry.This material was last updated on 15 May 2026. It covers the period from 1 January 1995 to 31 March 2026 and contains property transactions which have been registered during that period. Contains HM Land Registry data © Crown copyright and database right 2026. This data is licensed under the Open Government Licence v3.0.
Disclaimer: Rightmove.co.uk provides this HM Land Registry data "as is". The burden for fitness of the data relies completely with the user and is provided for informational purposes only. No warranty, express or implied, is given relating to the accuracy of content of the HM Land Registry data and Rightmove does not accept any liability for error or omission. If you have found an error with the data or need further information please contact HM Land Registry.
Permitted Use: Viewers of this Information are granted permission to access this Crown copyright material and to download it onto electronic, magnetic, optical or similar storage media provided that such activities are for private research, study or in-house use only. Any other use of the material requires the formal written permission of Land Registry which can be requested from us, and is subject to an additional licence and associated charge.
Map data ©OpenStreetMap contributors.
Rightmove takes no liability for your use of, or reliance on, Rightmove's Instant Valuation due to the limitations of our tracking tool listed here. Use of this tool is taken entirely at your own risk. All rights reserved.