
House Prices in Chevin End
House prices in Chevin End have an overall average of £319,523 over the last year.
The majority of properties sold in Chevin End during the last year were terraced properties, selling for an average price of £268,618. Semi-detached properties sold for an average of £328,454, with detached properties fetching £555,000.
Overall, the historical sold prices in Chevin End over the last year were 3% down on the previous year and 6% up on the 2022 peak of £301,200.
Properties Sold
28, Bank Parade, Otley LS21 3DY

| Today | See today's value |
| 20 Aug 2026 | £290,000 |
| 4 Dec 1998 | £62,500 |
No other historical records.
22, Bradford Road, Otley LS21 3EQ

| Today | See today's value |
| 31 Jul 2026 | £248,000 |
| 22 Jul 2015 | £175,000 |
No other historical records.
16, Newstead Road, Otley LS21 3JB
| Today | See today's value |
| 17 Jul 2026 | £450,000 |
| 18 May 2001 | £142,000 |
No other historical records.
29, Milner Bank, Otley LS21 3NE
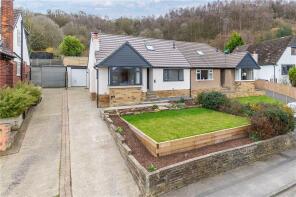
| Today | See today's value |
| 16 Jul 2026 | £399,950 |
| 5 Jul 2024 | £240,000 |
No other historical records.
25, Bank Parade, Otley LS21 3DY

| Today | See today's value |
| 10 Jul 2026 | £346,250 |
| 31 May 2017 | £216,000 |
131, Bradford Road, Otley LS21 3LH

| Today | See today's value |
| 10 Jul 2026 | £295,000 |
| 12 Jun 2013 | £158,000 |
62, West Busk Lane, Otley LS21 3LY
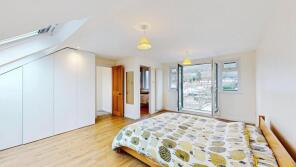
| Today | See today's value |
| 5 Jun 2026 | £440,000 |
| 19 Mar 2004 | £162,500 |
22, Fawkes Drive, Otley LS21 3NY

| Today | See today's value |
| 3 Jun 2026 | £535,000 |
| 12 Dec 2003 | £225,000 |
No other historical records.
31, Sunnydale Crescent, Otley LS21 3LU

| Today | See today's value |
| 8 May 2026 | £259,500 |
| 31 Jan 1997 | £54,000 |
No other historical records.
3, Saville Court, Otley LS21 3HG

| Today | See today's value |
| 5 May 2026 | £250,000 |
| 21 Apr 2017 | £195,950 |
23, Milner Bank, Otley LS21 3NE
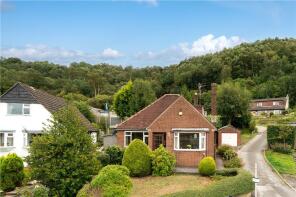
| Today | See today's value |
| 1 May 2026 | £340,000 |
No other historical records.
18, Sunnydale Ridge, Otley LS21 3LR

| Today | See today's value |
| 30 Apr 2026 | £270,000 |
| 4 May 2001 | £83,000 |
No other historical records.
73, Ilkley Road, Otley LS21 3LP

| Today | See today's value |
| 17 Apr 2026 | £200,000 |
| 21 Oct 2024 | £195,000 |
5, Waites Terrace, Otley LS21 3BE

| Today | See today's value |
| 10 Apr 2026 | £162,500 |
| 1 Mar 2004 | £96,000 |
36, Westbourne Grove, Otley LS21 3LJ

| Today | See today's value |
| 27 Mar 2026 | £315,000 |
| 28 Jun 2013 | £181,000 |
35, Kineholme Drive, Otley LS21 3LX
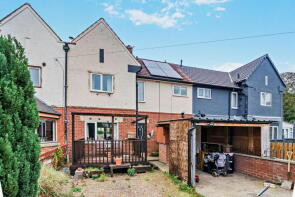
| Today | See today's value |
| 13 Feb 2026 | £210,000 |
No other historical records.
85, Burras Lane, Otley LS21 3EP

| Today | See today's value |
| 6 Feb 2026 | £232,500 |
| 14 Aug 2013 | £120,000 |
34, Pegholme Drive, Otley LS21 3NZ

| Today | See today's value |
| 5 Feb 2026 | £415,000 |
| 11 Jan 2019 | £335,000 |
No other historical records.
24, Bank Parade, Otley LS21 3DY
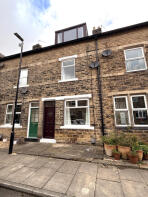
| Today | See today's value |
| 30 Jan 2026 | £260,000 |
No other historical records.
25, Kineholme Drive, Otley LS21 3LX

| Today | See today's value |
| 16 Jan 2026 | £315,000 |
| 13 Sep 2002 | £87,000 |
5, Saville Court, Otley LS21 3HG

| Today | See today's value |
| 12 Jan 2026 | £225,000 |
| 31 May 2002 | £88,000 |
No other historical records.
9, Saville Court, Otley LS21 3HG

| Today | See today's value |
| 12 Jan 2026 | £285,000 |
| 3 Feb 2003 | £129,500 |
No other historical records.
Flat 1, 15-17, Kirkgate, Otley LS21 3HN

| Today | See today's value |
| 19 Dec 2025 | £157,000 |
| 12 Dec 2006 | £111,001 |
No other historical records.


Rightmove takes no liability for your use of, or reliance on, Rightmove's Instant Valuation due to the limitations of our tracking tool listed here. Use of this tool is taken entirely at your own risk. All rights reserved.