
House Prices in Denchworth North
House prices in Denchworth North have an overall average of £422,286 over the last year.
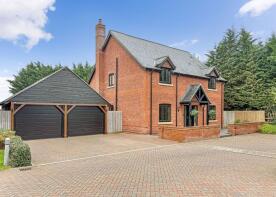
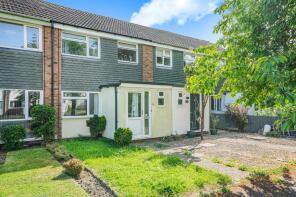
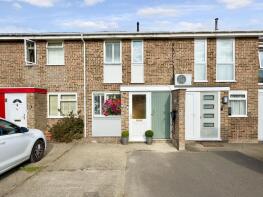
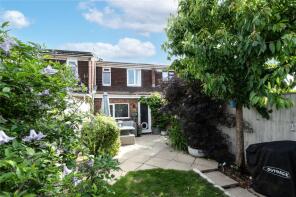
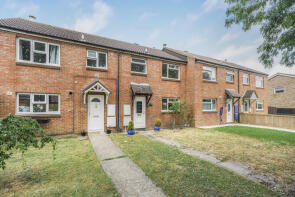
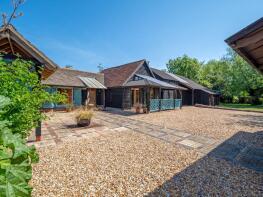
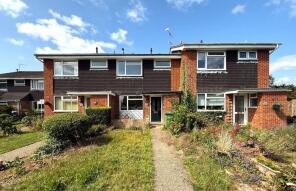
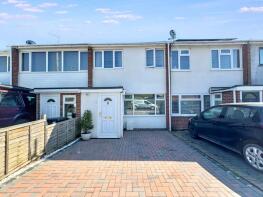
The majority of properties sold in Denchworth North during the last year were detached properties, selling for an average price of £594,813. Terraced properties sold for an average of £271,727, with semi-detached properties fetching £409,857.
Overall, the historical sold prices in Denchworth North over the last year were 8% up on the previous year and similar to the 2021 peak of £422,112.
Properties Sold
12, Lamble Walk, East Hanney, Wantage OX12 0FU
| Today | See what it's worth now |
| 2 Mar 2026 | £390,000 |
| 6 Nov 2020 | £375,000 |
No other historical records.
12, Cherbury Green, Grove, Wantage OX12 0DB
| Today | See what it's worth now |
| 27 Feb 2026 | £350,000 |
| 17 Jan 2006 | £199,950 |
No other historical records.
1, Winter Lane, West Hanney, Wantage OX12 0LF
| Today | See what it's worth now |
| 26 Feb 2026 | £600,000 |
| 29 Mar 2019 | £310,000 |
1, Knights Green, Grove, Wantage OX12 7FF
| Today | See what it's worth now |
| 23 Feb 2026 | £410,000 |
| 6 Jul 2023 | £395,000 |
6, Mandhill Close, Grove, Wantage OX12 7HY

| Today | See what it's worth now |
| 30 Jan 2026 | £250,000 |
| 20 Jul 2007 | £299,950 |
9, Newlands Drive, Grove, Wantage OX12 0NY
| Today | See what it's worth now |
| 30 Jan 2026 | £240,000 |
| 16 Feb 2007 | £165,000 |
9, Bramley Close, East Hanney, Wantage OX12 0JX
| Today | See what it's worth now |
| 30 Jan 2026 | £435,000 |
| 4 Sep 2020 | £355,000 |
17, Cherbury Green, Grove, Wantage OX12 0DB
| Today | See what it's worth now |
| 9 Jan 2026 | £335,000 |
| 29 Jan 2016 | £236,000 |
25, Broadmarsh Close, Grove, Wantage OX12 0NH
| Today | See what it's worth now |
| 9 Jan 2026 | £290,000 |
No other historical records.
Orchard Cottage, Summertown, East Hanney, Wantage OX12 0JG
| Today | See what it's worth now |
| 9 Jan 2026 | £1,225,000 |
No other historical records.
41, Broadmarsh Close, Grove, Wantage OX12 0NH
| Today | See what it's worth now |
| 19 Dec 2025 | £310,000 |
| 17 Feb 2022 | £293,000 |
26, Northrop Gardens, Grove, Wantage OX12 0PN
| Today | See what it's worth now |
| 19 Dec 2025 | £280,000 |
| 15 Dec 2023 | £260,000 |
No other historical records.
28, Northrop Gardens, Grove, Wantage OX12 0PN

| Today | See what it's worth now |
| 17 Dec 2025 | £280,000 |
| 15 Dec 2023 | £249,995 |
No other historical records.
8, Shepherds Close, Grove, Wantage OX12 0NX
| Today | See what it's worth now |
| 15 Dec 2025 | £235,000 |
| 23 Oct 2012 | £161,500 |
Lower Manor, Main Street, East Hanney, Wantage OX12 0HX
| Today | See what it's worth now |
| 15 Dec 2025 | £1,087,500 |
No other historical records.
6, Aldworth Close, East Hanney, Wantage OX12 0FS
| Today | See what it's worth now |
| 9 Dec 2025 | £750,000 |
| 28 Feb 2019 | £640,000 |
No other historical records.
34, Albermarle Drive, Grove, Wantage OX12 0NB
| Today | See what it's worth now |
| 8 Dec 2025 | £255,000 |
| 18 Aug 2006 | £159,000 |
41, Kennet Close, Grove, Wantage OX12 0NJ
| Today | See what it's worth now |
| 4 Dec 2025 | £278,500 |
| 19 Dec 2014 | £190,000 |
21, Kingfishers, Grove, Wantage OX12 7JL
| Today | See what it's worth now |
| 4 Dec 2025 | £269,000 |
| 3 Jul 2020 | £222,500 |
No other historical records.
24, Columbia Way, Grove, Wantage OX12 0QJ
| Today | See what it's worth now |
| 1 Dec 2025 | £255,000 |
| 3 Oct 2012 | £156,000 |
No other historical records.
Barnbrook, The Green, Grove, Wantage OX12 0AW
| Today | See what it's worth now |
| 24 Nov 2025 | £765,000 |
No other historical records.
105, Sharland Close, Grove, Wantage OX12 0AF
| Today | See what it's worth now |
| 14 Nov 2025 | £250,000 |
| 6 Oct 1995 | £56,500 |
No other historical records.
12, Kingfishers, Grove, Wantage OX12 7JL
| Today | See what it's worth now |
| 12 Nov 2025 | £270,000 |
| 13 Dec 2016 | £230,000 |
Source Acknowledgement: © Crown copyright. England and Wales house price data is publicly available information produced by the HM Land Registry.This material was last updated on 15 May 2026. It covers the period from 1 January 1995 to 31 March 2026 and contains property transactions which have been registered during that period. Contains HM Land Registry data © Crown copyright and database right 2026. This data is licensed under the Open Government Licence v3.0.
Disclaimer: Rightmove.co.uk provides this HM Land Registry data "as is". The burden for fitness of the data relies completely with the user and is provided for informational purposes only. No warranty, express or implied, is given relating to the accuracy of content of the HM Land Registry data and Rightmove does not accept any liability for error or omission. If you have found an error with the data or need further information please contact HM Land Registry.
Permitted Use: Viewers of this Information are granted permission to access this Crown copyright material and to download it onto electronic, magnetic, optical or similar storage media provided that such activities are for private research, study or in-house use only. Any other use of the material requires the formal written permission of Land Registry which can be requested from us, and is subject to an additional licence and associated charge.
Rightmove takes no liability for your use of, or reliance on, Rightmove's Instant Valuation due to the limitations of our tracking tool listed here. Use of this tool is taken entirely at your own risk. All rights reserved.